
Originally published on Hearso Writing on 2026-09-28. Hearso is the team trivia game I build and run; these posts are the engineering notes from building it.
Eight load runs, four in production: each fix exposed the next limit, a burst turned signed-in hosts into guests, and our harness made six mistakes.
At 00:40Z on 2026-09-28, our load test signed in 25 test hosts at once, and 25 rooms came out the other side as if guests had made them.
Those rooms were born as real traffic. For about 40 minutes, our own "games hosted" number read about 9% too high. (Our traction was briefly better than our traction.)
Hearso is standup icebreaker trivia, and its riskiest second is the reveal: a game ends, and a whole team opens the same leaderboard at once. We wanted to know whether production survives that second, and what breaks first.
Between 15:55Z on 2026-09-27 and 00:44Z on 2026-09-28, we ran eight load tests with synthetic players, four of them against production. The harness plays real games through the app's own routes, then opens the board many times at once.
Short answer: production held every reveal we could actually send, and every fix moved the load to the next limit. A 5-second board cache took our read function from 50 of 50 concurrent executions and 74 throttles to a peak of 3 and none. The same run filled the write function's cap of 25. The biggest run found a real product bug: under a burst, a signed-in host silently became a guest.
The harness made six mistakes of its own, and it caught one of them itself. That one is the title.
It is a sequel to Evals from scars: 20 failures our unit tests never caught, which told the first half: hypothesis H1, the read function's cap of 10, and the first 8 lost scores. I link to those stories rather than repeat them.
Why test the reveal in production at all?
A load test has one job: to say where the real system refuses work first. A copy that is missing a part cannot answer for that part. Our DEV runs served pages from a laptop. So they could not show how Vercel, the shared read key and the real leaderboard behave together. Production could.
The price is that a test in production can become production data. That risk shaped every guard below.
We read results from the harness's report, CloudWatch, the API Gateway access log, Vercel's request log, and SQL with a control in every query. The harness lives in the web repository (scripts/loadtest, web #518 and #520).
Two hypotheses, written before any cache-on run and quoted from the last post. The cache is web #515: board reads share one server-side copy for 5 seconds.
- H2. With the cache, API calls fall to about one per board per 5 seconds per warm instance, and 429s to zero.
- H3. Coalescing is per instance, so a burst spread over many warm instances makes more calls than H2's number. The test must count API calls, not only page errors.
One more hypothesis, written after the runs, so it's weaker evidence: a harness can load production safely if every guard in it can fail and each run is judged against a prediction written beforehand. If so, its own checks should catch its own mistakes first. We judge it near the end.
How do you load-test production without polluting it?
Think of a fire drill run with cardboard people in a real office. You tag each one before they enter, count them in, and afterwards prove the building holds only its real staff. If a tag falls off, the real headcount is wrong until someone fixes it.
A coding agent built the harness (web #518), and web #520 added the production preflights. Each guard below exists because a run could otherwise leave a trace in real data, or report a result it never measured.
Players who are test traffic from their first row
Each synthetic player is a guest named lt-<runid>-pNNN. Each room has one signed-in test host on a reserved mail domain, whose profile is flagged is_test = true and read back before it creates a room. Its session comes from the auth admin API: no password, mail or captcha.
That flag is the app's own mechanism. The create route takes a room's test status only from a signed-in host's server-flagged profile. So the room, its activity rows and its three games-ledger rows (created, started, finished) are born as test traffic.
One more step matters later: each new room is read back, and a room whose host was treated as a guest is discarded unplayed.
The cost guard, and typing the run's name twice
The harness refuses any plan above 300 players, 1,000 page views, 30 hosts, an estimated $1, or 5% of the Vercel Hobby allowance. plan prints the estimate without sending anything. Run 3, our largest, was estimated at $0.0504 and 4.51% of the allowance's CPU time.
A production run also needs --confirm-prod=<runid>, repeating the run's own id. A wrong target, or a command pasted from a DEV run, fails before anything is created.
Three preflights before the first room
- The session proof.
prove-sessionruns once per target and plays nothing: one host, one session, a read ofGET /api/profileas that host, a check that the captcha refuses a sign-in, then erase and verify zero. The agent's permission check refused it on production, since it writes to production auth, so I ran it by hand. Its first version could not fail: mistake 1. - The web-session preflight (web #520). Before every run's first room, the harness asks the web server whether it sees the first test host as that host. A build wired to another Supabase project answers "unauthenticated", and the run stops with nothing played, instead of playing in one database while its checks read another.
- The read key, read by name (web #520). The harness fetches the leaderboard's read key from API Gateway by its exact name, and its fingerprint equalled the web server's in both environments. Before this, it read production's board with no key: mistake 2.
Cleanup is never blocked by the key: only a 404 on a standing counts as erased, so a refused keyless check reads as "not verified", never as "gone".
One input had to follow the environment. Since web #521, a topic with fewer than 10 questions is refused with 409 topic_too_small, and DEV's bank is 50 untagged general-knowledge questions. So the default topic is now general on DEV and nature on PROD (e874293f).
The checks that fail the run
- The ledger check. Every ledger row the run produced must be
is_test = true, no activity row may count as real, and no real row of the run's topic may appear in its window. Any failure exits 1. Each ledger and cleanup check was broken by hand once, and its test went red (web #518). - Cleanup, with a proof of zero. The harness erases every player's leaderboard rows, expects a 404 for each standing, deletes the run's rooms, profiles, hosts and auth accounts, then counts 20 things at zero, down to auth users by id and by address. It never touches the two append-only tables, the games ledger and daily activity: the service role can insert there but not update or delete. That is why mistake 4 needed an owner.
- A read from outside the harness. After each production run we ran our own SQL with a control: a count the query must see if it works at all, 430 real profiles in PROD and 5 real accounts in DEV. A zero from a query that could see nothing looks exactly like a clean database, as What we got wrong about checks that pass when nothing happened explains.
Eight runs, one table
With those guards in place, this is everything we ran. All times UTC. "Cap: peak" is a function's reserved concurrency and its highest ConcurrentExecutions in the run's window. Query is the leaderboard's read function, Submission its write function. PROD pages came from Vercel; DEV pages from a local next start (no Vercel cache header on any response).
| Run | When | Env | Players / rooms | Board views | Cache | Query cap: peak | Submission cap: peak | Pages that drew the board | Scores landed | Ledger rows born is_test |
|---|---|---|---|---|---|---|---|---|---|---|
092715550go | 09-27 15:55 | DEV | 20 / 2 | 50 over 1 s | off | 10: 10 (2 throttles) | 25: 10 | 48 / 50 | 20 / 20 | 4 of 6 (guest hosts) |
09271621mxu | 09-27 16:21 | DEV | 20 / 2 | 50 over 1 s | off | 50: 22 | 25: 10 | 50 / 50 | 20 / 20 | 6 / 6 |
prodp0smoke | 09-27 16:46 | PROD | 12 / 1 | 20 over 1 s | off | 50: 6 | 25: 12 | 20 / 20 | 12 / 12 | 3 / 3 |
prodp1off | 09-27 17:19 | PROD | 100 / 9 | 200 over 1 s | off | 50: 50 (74 throttles) | 25: 12 | 117 / 200 | 92 / 100 | 27 / 27 |
devab100 | 09-27 18:04 | DEV | 100 / 9 | 200 over 1 s | labelled off* | 50: 2 | 25: 12 | 200 / 200 | 100 / 100 | 27 / 27 |
devp2keys | 09-27 19:12 | DEV | 12 / 1 | 20 over 1 s | labelled off* | 50: 2 | 25: 12 | 20 / 20 | 12 / 12 | 3 / 3 |
prodp2on | 09-28 00:04 | PROD | 100 / 9 | 200 over 1 s | on | 50: 3 | 25: 25 (16 throttles) | 200 / 200 | 99 / 100 | 27 / 27 |
prodp3peak | 09-28 00:40 | PROD | 300 / 25 planned; 252 / 21 played | 1,000 at once | on | 50: 3 | 25: 24 | 200 / 1,000 (800 never answered) | 252 / 252 | 21 of 46 created (FAIL) |
* Inferred. devab100's page server already contained the cache (see the last post). devp2keys's build is not recorded, but its p50 time to first byte of 8 ms and Query peak of 2 fit a cache too. Neither compares with the PROD pages.
The first five runs are in the last post. devp2keys checked the harness on DEV about 2 minutes after phase 2 of key enforcement went live there (19:09:51Z): 202 board reads answered 200, and the access log showed no 403. The gateway's metric counted 2 4xx the access log does not show; I can't attribute them. Runs 2 and 3 (prodp2on, prodp3peak) are this post.
Each fix found the next limit
A limit here is the first thing that refuses work as load rises. Fix it, and load rises further, into the next one. These six are in the order we met them.
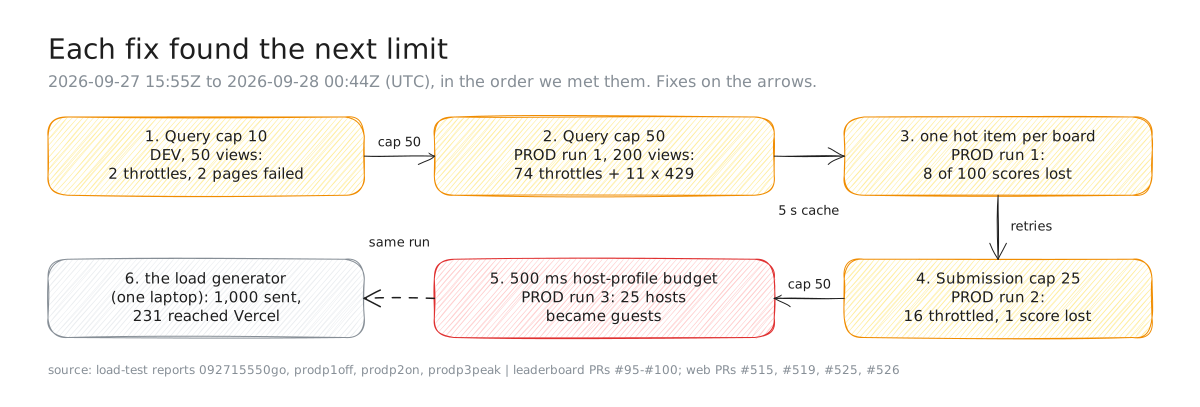
Figure 1. The cascade, 2026-09-27 15:55Z to 2026-09-28 00:44Z (UTC). Numbers from each run's report and CloudWatch window. Steps 1 to 3 are told in the previous post.
1 and 2. The Query caps (told last time). Our own cap of 10 threw throttles on DEV, which reached players as 500s; leaderboard #95 and #96 raised it to 50. PROD run 1 then filled the 50 exactly, and 83 of 200 pages failed. The fix already existed: the cache, live with beta.12 at 22:42Z.
3. One hot item per board (told last time). Every submission updates its board's histogram item inside one DynamoDB transaction, so 100 finishes at once collide, and run 1 lost 8 of 100 scores. Leaderboard #97 and web #519 now retry up to 8 times inside the function, then up to 3 times from the web with the same idempotency key.
We thought we had met this limit before: on 2026-08-19, 475 of 1,000 submissions to one board failed at 64 in flight (Reads, not writes). A re-run on 2026-09-28 showed those were mostly Lambda throttles at an account limit of 10. With that limit gone, conflict alone failed 50 of 1,000 at 64 in flight. What was new is that a real reveal reaches it.
4. The Submission cap of 25 (PROD run 2). With the cache and #97 live, run 2 repeated run 1's load. Submission peaked at exactly 25, its reserved concurrency, and 16 submissions were throttled, returned as 500 INTEGRATION_FAILURE. The web's same-key retry recovered 15; 99 of 100 scores landed, against 92 in run 1.
Leaderboard #100 raised the cap to 50 on DEV at 01:26:14Z. Its change set, read in full, changed only the cap. Promoting it also shipped phase 2 of key enforcement, whose last gate waited for a relay submission that production could not produce while it had no WebSocket rooms. So on 28 September we decided to promote both together, after checking the relay's key directly.
Here's how that went, on 2026-09-28:
- 16:04Z-16:09Z: the PROD relay's key fingerprint matched the gateway's Submit key, enabled and in the PROD usage plan.
- 16:07:56Z: #100 merged; 16:21Z: the promotion, #101, merged.
- 16:28:36Z: the PROD change set finished,
UPDATE_COMPLETEwith 0 failed events. It was read in full first: 11 changes, 0 replacements. - Checked right after: reservations Submission 50, Query 50, PlayerStats 10. A keyless board request got
403 AUTH-ERROR-001; the same request with the read key got 200 with 3 entries.
We learned one thing the annoying way on that last step. The first probes came back 400 AUTH-ERROR-007, from a malformed query and missing contract headers, which said nothing at all about keys. A refusal only counts as a key check once the same request succeeds with the key.
Production's Submission cap is now 50. Nobody has re-run run 2's load against it yet.
Why the cap filled is not settled. #100 blames #97: its retries wait inside the invocation, so each submission holds its slot longer, and run 1, before #97, peaked at 12. But devab100 ran the same #97 code at the same size and also peaked at 12. Submission durations were close across the three runs, too: p50 252, 267 and 305 ms; p95 1,156, 1,140 and 1,238 ms (run 1, devab100, run 2).
So the data do not show #97 making submissions much slower. One untested difference: DEV's page server was one local process, while Vercel may send a room's submissions from more places at once. The cause stays open.
5. The create route's host-profile budget (PROD run 3). Run 3 planned 300 players in 25 rooms, all created at once, then 1,000 views. The leaderboard held: Submission peaked at 24 of 25 with 0 throttles, all 252 submitted scores landed, and Query peaked at 3. The next limit was in our own web server.
The create route looked up a signed-in host's profile within a 500 ms budget. Under the burst the lookup timed out, and the route treated the host as a guest. Room creation slowed from p50 2,746 / p95 2,891 ms in run 2 to p50 3,538 / p95 6,881 ms, and 25 of 46 creates came back as guest rooms, born as real traffic: mistake 4.
A timeout has to decide what happens when it fires. This one carried on with a different answer to "who is this?", and a wrong answer is quieter than a refusal.
It is also a product bug. A real signed-in host who creates a room at a busy moment silently loses the room's link to their account.
The fix shipped in beta.13, live on 28 September at 05:34Z. Web #525 makes the route fail closed: a signed-in host whose profile cannot be read in time gets 503 profile_unavailable and presses again, and no guest room is created.
We re-measured the wait before choosing new budgets. On DEV, with 25 profile reads at once, 41 of 800 took longer than 500 ms and the slowest took 1.4 s. So the budget is now 1 s for the session and 1.5 s for the profile.
Web #526 closes the same gap for a sign-in service that answers with an error rather than slowly. The harness learned to wait out the new 503 at 16:52Z (web #520, merged later that day). Nothing has re-measured run 3 against the fix yet.
6. The load generator (PROD run 3). The last limit belonged to the harness: the laptop running it could not open 1,000 connections at once. That's mistake 3.
Did the cache do what we predicted?
The cascade says what refused work. The hypotheses asked something narrower, and they were written down first. Run 2 repeated run 1 with two changes: the cache was on, and the score fixes (#97, #519) were live. Same 100 players in 9 rooms, same 200 views over 1 second, same Query cap of 50.
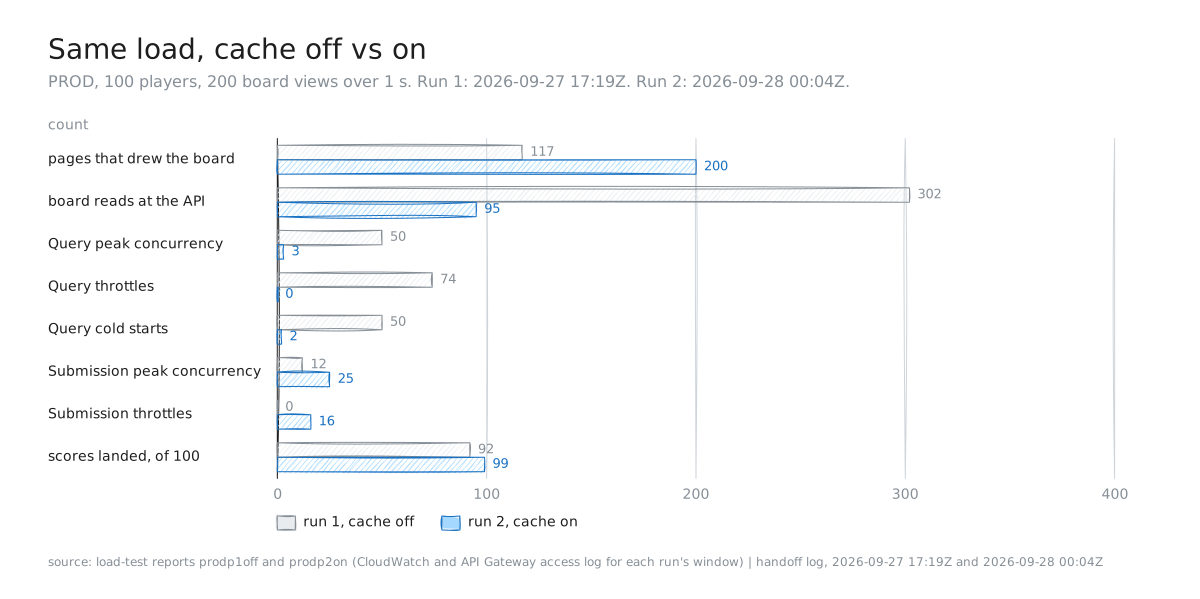
Figure 2. The cache removed the read limit and exposed the write limit: PROD prodp1off (2026-09-27 17:19Z) and prodp2on (2026-09-28 00:04Z), one run each, same load.
| PROD, 100 players, 200 views | Run 1, cache off (17:19Z) | Run 2, cache on (00:04Z) |
|---|---|---|
| Pages that drew the board | 117 of 200 | 200 of 200 |
| Gateway 4xx on board reads | 11 | 0 |
| Query throttles | 74 | 0 |
| Query peak concurrency | 50 | 3 |
| Query invocations / cold starts | 217 / 50 | 96 / 2 |
| Board reads at the API, all | 302 | 95 |
| of which the harness's own freshness reads | 68 | 67 |
| Board reads from the web server (derived) | about 234 | about 28 |
| Page time to first byte, p50 / p95 | 1,251 / 2,349 ms | 1,166 / 1,643 ms |
H2 holds for errors; the call rate is consistent, not verified
The 429 half holds. The gateway returned 0 4xx in run 2's window, Query threw no throttles, and all 200 pages drew the board.
The call-rate half is consistent, not verified. Board reads from the web server fell from about 234 to about 28 over each run's 4-to-5-minute window. That's H2's direction. But H2 is stated per board, per 5 seconds, per warm instance, and we did not read the cache's per-instance minute line (board-cache: 60s hit= miss= ...) during the run. So the instance count is unknown.
The page was not much faster, and H2 never said it would be. Median time to first byte went from 1,251 to 1,166 ms, and every page response was a Vercel cache MISS. The board cache sits behind the page: it shields the API, not the render.
Freshness held. 99 of the 100 finished players appeared in the API's top 500 (p95 2.9 s after finishing), and all 25 measurable on the page did (p95 2.7 s). The one never seen is most likely the lost score.
H3 is not answered, because the run was invalid
H3 needed more warm instances than run 2 could make: run 3's 1,000 views at once. The harness reported 200 pages that drew the board and 800 network-errors. A network-error only says the client got no response; on its own it can't say whether the request ever left the machine.
Vercel's request log for that window shows 231 requests to /leaderboard, all answered 200, and that count includes the run's freshness polls. So at most 231 of the 1,000 views reached the server, and at least 769 never did. Without matching requests one by one, we can't say what the other 31 were.
The harness's timers agree: views meant to fire together fired up to 199 ms late (p50 114 ms), where run 2's worst was 1 ms. Inferred: one laptop could not open 1,000 connections at once. The 200 that got through (time to first byte p50 6.2 s) are skewed by the same limit, so we don't use them.
The backend half is valid, with Query at a peak of 3 and 0 throttles. But only 231 page requests arrived, so it says nothing about 1,000 simultaneous views. H3 stays open as written.
The run that touched real production counts
Run 3 was invalid as a reveal test. It was also the run that wrote to real counts. This mistake mattered most, and it's the one the harness caught itself.
Expected. Every room is born is_test = true, because its host is a flagged test account. If a host is ever treated as a guest, the harness reads the room back and discards it unplayed.
Happened. The host-profile lookup timed out (step 5 above), and 25 rooms were created as guest rooms, their created ledger rows written as real between 00:40:51Z and 00:40:58Z. The harness discarded all 25; 21 replacements were born test and played, and 4 rooms never played. 12 of the run's daily-activity rows were also counted as real.
The discard worked, and it was too late. The ledger row is written at creation, before the harness can read the room back, and the service role cannot update it.
A guard that acts after the write can only report it.
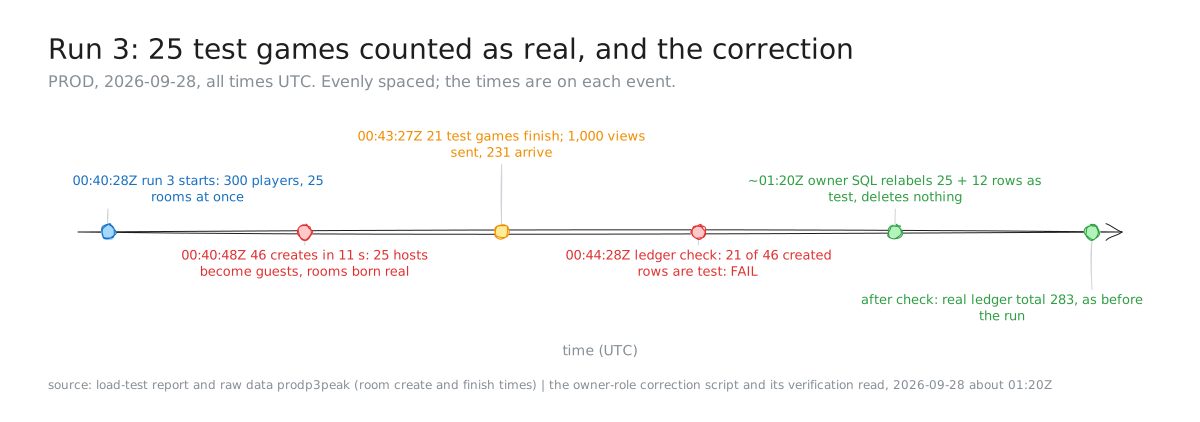
Figure 3. Run 3's contamination and its correction, 2026-09-28 (UTC). Sources: the prodp3peak report and raw data, the correction script and its verification read.
Found by. The harness's own ledger check: created: 21 is_test rows, expected 46 (a run row was born real), exit 1. The stop rule then applied: no more production runs that night.
Cost. Production held 283 real created rows before the run. The run added 25 more marked real, so "games hosted" read about 9% too high, and daily actives up to 12 too high. For about 40 minutes, from the run to the correction, our traction numbers were wrong.
Changed. At about 01:20Z, the correction script ran with the owner role. It deleted nothing, but it did change rows: the 25 ledger rows and 12 activity rows became is_test = true. That broke a rule both tables document. They are append-only, and the ledger's own comment says it is "never updated, deleted, or backfilled": the owner role can do it, and operator SQL is not supposed to. Each statement is bounded by the run's 10-second window or its player prefix and asserts its exact count, and the transaction rolls back if either differs.
The separate proof read: 0 real ledger rows in the window, 0 real activity rows for the run, and 283 real ledger rows in total, as before the run. The window holds 46 test created rows, and all 256 of the run's activity rows are test.
Five more mistakes, and what caught each
Each is told the same way: what we expected, what happened, what found it, what it cost, and what changed.
1. The captcha probe that could not fail
- Expected. The session proof checks that production's captcha refuses a tokenless sign-in: proof that the harness's captcha-free path is the exception.
- Happened. The first production proof reported
captchaOn=false. The probe had fallen back to the service-role key, which Supabase exempts from the captcha, so it could only ever say "off". A check with one possible answer is not a check. - Found by. Reading the output against what we knew: a direct sign-in with the public browser key and no token was refused with
captcha_failed. - Cost. One invalid production proof and a second run by hand. No game ran on it: the fix (
475576a8) landed at 16:43:05Z, before run 0 at 16:46:23Z. - Changed. The probe now accepts only a browser key (a publishable key or an anon-role token) and otherwise reports "not examined". A confirmed production proof fails unless the captcha refused.
2. Keyless harness reads in the phase-2 gate
- Expected. Phase 2 of our key rollout (leaderboard #99) refuses any call without its key. Its gate counted phase-1 log lines with no key (
apiKeyVerdict = absent): each names a caller phase 2 would break. - Happened. PROD showed 197
absentlines, 85 on Query and 112 on PlayerStats. 195 were our harness, during runs 0 and 1, because production's environment file held no read key. - Found by. Attributing the lines by time, in 10-minute bins: PlayerStats 12 at 16:50Z and 100 at 17:20Z, the standings checks of runs 0 (12 players) and 1 (100 players); Query 9 at 16:40-16:50Z and 74 at 17:20Z, their freshness reads. The other 2 were check reads after deploys.
- Cost. The gate for phase 2 counted our own test tool as an unknown caller until every line was attributed. Had phase 2 gone live first, every production load run would have read as failed, its checks refused with 403.
- Changed. The harness reads the key by name (web #520, 19:03:28Z).
devp2keysthen ran under enforcement on DEV: 202 board reads answered 200. Its control was the rollout probe: with no key or a wrong key, the same routes answered 403. (Update, 2026-09-28: phase 2 went live in production at 16:28:36Z, so this change is what keeps future production runs working.)
3. A laptop as the load generator
- Expected. Run 3 sends 1,000 board views at once and measures how many instances the cache must fill.
- Happened. 800 of the 1,000 got no answer, while Vercel logged 231 requests to
/leaderboard, all 200. The limit was on the sending side. - Found by. Comparing the harness's count with the server's. Alone, the harness reported 800 failed page views, which a reader could have blamed on the cache or Vercel.
- Cost. The 1,000-view half of our largest production run, and with it H3. The backend half stands.
- Changed. Not yet. The fix is a distributed load generator (Grafana Cloud k6 is already in our stack), plus a harness check that marks the reveal invalid when requests sent and requests logged differ.
5. A dashboard filter that counted retries as refusals
- Expected. Between runs 2 and 3, our Grafana dashboard gained a CloudWatch leaderboard row and a critical alert, "refused a score after its retries", counting log lines whose code is
SYSTEM-ERROR-001. - Happened. The filter matched the code anywhere in a line. Every retry line (
RETRY-WARNING-001) names the error that caused it,"causeLogCode":"...SYSTEM-ERROR-001", so "refused" equalled "retried". - Found by. Querying run 2's window, where the answer was known: 93 refusals and 93 retries, two counts that should never agree on a healthy run.
- Cost. Nothing paged; the query caught it first. Left in place, the critical alert would have fired on every burst of retries, the very load the fix absorbs, and an alert that fires on success soon gets muted.
- Changed. The filter now matches the line's own field,
"logCode":"<code>". Its positive control is run 1's window, where #97 had measured 148 retries and 8 refusals: the fixed panel reads 148 and 8.
6. CloudWatch lag read as zero
- Expected. When beta.12 went live at 22:42Z, two board loads about 40 seconds apart should show as two Query invocations, both keyed.
- Happened. The first count read 0.
- Found by. Counting again 3 minutes later: 2 invocations, both keyed.
- Cost. Minutes, and a wrong conclusion we did not act on: a zero could have started a hunt for missing reads or a wrong key.
- Changed. A practice, not code: read a fresh CloudWatch count again after the lag, and write a zero beside the events that could have produced it, here 2 page loads.
Did the harness catch its own mistakes?
The hypothesis said that if every guard can fail, the harness's own checks should catch its mistakes first. Here's what first caught each one:
| # | Mistake | First caught by | The two counts that disagreed |
|---|---|---|---|
| 1 | Captcha probe | A direct sign-in, outside the harness | probe "off" vs captcha_failed |
| 2 | Keyless reads | The phase-2 gate's log query | 197 absent lines vs the run windows |
| 3 | Laptop as generator | Vercel's request log | 1,000 sent vs 231 received |
| 4 | Run 3 in real counts | The harness's ledger check | 46 rooms created vs 21 born test |
| 5 | Dashboard filter | A query over a known window | 93 refusals vs 93 retries |
| 6 | CloudWatch lag | A second read, 3 minutes later | 0 invocations vs 2 page loads |
The hypothesis half held. The harness's own checks caught 1 of 6 mistakes. It was the one that reached real data, and the check named the rows precisely enough to fix them without deleting anything.
The other five were caught by a second count, from a system the harness does not control, that disagreed with the first. Two were checks whose answer did not depend on the truth (1 always said "off"; 5 said "refused" for every retry), and one was a count read too early. So "every guard can fail" is necessary, and not enough.
The rule we now apply: every number the harness reports gets a second count from outside it. One gap is known: comparing sent with received would have let the harness catch mistake 3 itself.
Two promises from the last post
Two loose ends from the last post were settled the same day. Both lean on the habit the six mistakes taught: a number is read next to a second one it can be checked against.
The connection pool: one round trip per answer
The last post guessed that "about one database round trip per pool acquire looks like a ping-before-use" in rt's connection pool. By default, the library checks each connection with a ping before handing it out. We tested that on DEV on 28 September, from 08:18Z to 09:02Z.
- Arm A was the live build, run from its existing image.
- Arm B was the same commit with one line changed,
test_before_acquire(false). - The games: both ran as fresh containers on the VPS, bound to localhost, against the DEV database. Ten one-game rooms were played in turn, A, B, A, B, by the bot kit, with 3 seats, 10 questions and human-like pauses.
- The yardstick: one round trip from the VPS to DEV measured 53.2 ms (median of 20).
room.answer, 150 answers per arm | A: ping on | B: ping off | Difference |
|---|---|---|---|
| Client median | 310.8 ms | 257.2 ms | -53.6 ms |
| Client p95 / slowest | 653.5 / 1,044.6 ms | 487.9 / 640.1 ms | |
| Server mean | 336.2 ms | 243.1 ms | -93.1 ms |
| Wait for a pooled connection | 60.2 ms | 2.7 ms | |
| Timeouts | 0 | 0 |
The guess held. The client median fell by 53.6 ms, one round trip. Every arm-B game's median was below every arm-A game's. The server saved more than one round trip, 93 ms, because the answer's own transaction lost one and it also waited less behind other commands in the same room. Single statements went from about two round trips to one: load_room_with_players fell from 109.7 to 59.1 ms.
The ping series the last post promised is clean: 297 and 298 pings, all 2xx, none 5xx, where on 27 September all 280 had been counted as 5xx.
Limits. One run per arm, on DEV, driven from a laptop through one tunnel; the tunnel's hop is in both arms' client times alike. Arm B's image was built that morning and arm A's the day before, from the same Dockerfile, so their base layers may differ. The change is on an unmerged branch and not in production. The cleanup left 10 outbox rows in DEV, because the service role may not delete from that table; removing them is an owner's decision.
The full write-up is in One database round trip was 17% of our median answer.
The log deletion held
On 27 September we asked Grafana Cloud to delete log lines that carried a player's identity.
On 28 September at 08:07Z, a search over the previous 30 days found 0 such lines, and 0 relay lines carrying a commandId. A zero is only worth something next to a control from the same streams. The same window returned 293 lines from the realtime service and 5,000 relay lines, the query's cap, so the search could see the streams it came back empty from.
What did the runs actually cost?
At most about 13 cents across both clouds, on the bills as they stood on 2026-09-28, with one AWS day still incomplete. That's the same order as the harness's own estimate, and the bills can't do better than a bound. Here's why, and the numbers.
The harness estimated the four production runs at $0.0864 together, AWS plus Vercel at Pro prices, as an upper bound that assumes the cache is off. On 2026-09-28 at 20:22Z I read both bills, read-only.
| Bill | Window (UTC) | What it includes | Billed |
|---|---|---|---|
| AWS: API Gateway, DynamoDB, Lambda, CloudWatch | 2026-09-26, no runs | Both environments, all traffic | $0.0111 |
| AWS: the same four services | 2026-09-27: the four DEV runs, runs 0 and 1 | Both environments, all traffic | $0.0231 |
| AWS: the same four services | 2026-09-28: runs 2 and 3, incomplete | Both environments, all traffic, as far as Cost Explorer had it | $0.0175 |
| Vercel: functions and delivery | 09-26 07:00 to 09-27 07:00, no runs | The whole team, all traffic | $0.0226 |
| Vercel: functions and delivery | 09-27 07:00 to 09-28 07:00: all four PROD runs | The whole team, all traffic | $0.0874 |
What the bills can't do is isolate the runs. Cost Explorer only gives whole days here: hourly data is an opt-in setting we don't have. Its days hold DEV and PROD, and every real game, deploy and check. Vercel's billing days run 07:00Z to 07:00Z, and they hold the beta.12 release day's traffic too.
So each number is a ceiling for the runs, not their cost. Added up, AWS on the run days ($0.0231 + $0.0175) and Vercel on the run day ($0.0874) come to $0.128. Subtract the quiet day before from each of those three days, and the extra is about $0.083.
A few details worth knowing:
- Lambda billed $0.00 on every day: its usage sat inside the free tier.
- API Gateway's billed price works out to $3.50 per million requests. The runs' own request counts (1,723 on 2026-09-27 and 752 on 2026-09-28, from each run's AWS window) come to about $0.006 and $0.003 at that price. That's arithmetic on measured counts, not a line on the bill.
- The 2026-09-28 AWS figure is incomplete. Cost Explorer lags about a day. When I read it, its always-on alarm usage showed 0.43 against the previous day's 1.45, so most of that day had not arrived yet. Runs 2 and 3 ran in its first hour, but Cost Explorer may not hold all of their usage.
- Fixed costs are left out: the Vercel Pro subscription ($0.67 a day), build minutes, and AWS key management ($0.065 a day). None of them move with load.
Predictions vs outcome
| Prediction | What happened | Right? |
|---|---|---|
| H2: with the cache, 429s fall to zero | 0 gateway 4xx, 0 Query throttles, 200 of 200 pages drew the board | Yes |
| H2: calls fall to about one per board per 5 s per warm instance | Web-server board reads fell from about 234 to about 28; the instance count was not read | Consistent, unverified |
| H3: a burst over many instances makes more calls than H2's number | Run 3's reveal was invalid: 231 of 1,000 requests arrived | Unanswered |
| #100: #97's in-function retries made Submission fill its cap | devab100 ran #97 at the same size and peaked at 12 | Not shown |
| A room whose host became a guest is caught before it counts | Caught, but after its ledger row was written as real | Half |
| A harness whose guards can fail catches its own mistakes first | It caught 1 of 6; a second, outside count caught the other 5 | Half |
| The pool's ping costs one round trip per answer | -53.6 ms at the client median, against a 53.2 ms round trip | Yes |
| The four PROD runs cost at most $0.0864 (the harness's estimate) | The bills bound them at $0.128 so far (one AWS day incomplete), across both clouds and all traffic, about $0.083 above the day before; they can't isolate the runs | Consistent |
Key takeaways
We asked whether production survives the reveal, and what breaks first. It held every reveal we could actually send. What broke first changed with every fix, and the last thing to break was our own test.
- Expect each fix to move the load to the next limit. The cache took Query from 50 of 50 to 3, and the same run filled Submission's 25.
- Guard before the write, not after it. The harness discarded every guest room after its ledger row was already written, so it could only report the damage.
- Correct without deleting, and name the rule you broke. Assert exact counts and verify against the total from before. Our relabel changed rows in an append-only table; a correction the tables allow, such as an appended correction row, would have kept the record intact.
- Treat your test tool as a caller. Our harness was 195 of the 197 keyless calls in the phase-2 gate.
- Count what you sent and what arrived. 1,000 sent and 231 received is not a server result, and 0 invocations for 2 page loads was lag, not a finding.
- Let the load test find product bugs. Under load, a signed-in host could silently become a guest.
What I'd do next
- Answer H3 with a distributed generator. It needs three things. First, load generators that are not one laptop: Grafana Cloud k6, already in our stack, can send from several machines. Second, a harness check that marks the reveal invalid when requests sent and requests Vercel logged differ. Third, the cache's per-instance minute line, read during the run. Run 3's shape was estimated at $0.0504 and 4.51% of the Hobby CPU allowance, inside the harness's guard.
- Re-run run 3's shape against the host fix. The fix (web #525, #526) is live since beta.13, and the harness learned to wait out its
503 profile_unavailable(web #520, merged 2026-09-28). The run needs a production window, the same stop rule, and one result above all: the ledger check proving 0 rooms born real with 25 rooms created at once. Refusals now count separately, so a burst may show 503s where it used to show guest rooms. - Re-run run 2's shape against the new Submission cap of 50, live in production since 16:28Z on 28 September.
- Read the cache's minute line during the next run, so H2 can be judged per instance. For a cost that isolates a run, hourly Cost Explorer data would have to be turned on in the payer account, or the run would need a quiet day of its own.
- Verify the saturation alert. The dashboard warns above 80% of a reservation. Run 3's Submission peak of 24 of 25 crossed that line; whether the alert fired is not in our notes.
How we measured
- The harness played real games through the app's own routes, one host per room, bots answering, then opened the board N times, either spread over 1 s or all at once. It recorded each view's status, what the page drew, and its time to first byte.
- AWS numbers come from CloudWatch metrics and Logs Insights, and the API Gateway access log, over each run's window. Submission durations are CloudWatch p50 and p95 over each window.
- "Board reads from the web server" is the access log's board reads (302 = 217 + 74 + 11, and 95) minus the harness's freshness reads (68 and 67). It's arithmetic, not a separate measurement.
- Page counts at the server come from Vercel's request log for each run's window.
- Estimated cost is the harness's, from public price pages. The four production runs were estimated at $0.0864 together (run 3: $0.0504). Billed cost comes from AWS Cost Explorer, daily by service and usage type, and Vercel's billing charges, daily by service, both read-only on 2026-09-28 at 20:22Z.
What we did not measure
- H3. Not answered; run 3's reveal was invalid. What it needs is in What I'd do next.
- The cache's per-instance rate, and why Submission reached 25 in run 2 when the same code peaked at 12 on DEV. Both are open.
- Production Submission at 50 under load. The cap has been live in production since 16:28:36Z on 28 September, checked by reading the reservations, but no load run has used it yet.
- The host downgrade fix under load. Shipped in beta.13 (web #525, #526), not yet re-measured at run 3's size.
- The runs' exact cost. The bills bound it but can't isolate it; see What did the runs actually cost?.
- Scope. One run per configuration, so no number has a spread. Only polled rooms: the WebSocket path is not in these runs. Production was still in phase 1 of key enforcement during every run.
Evidence
All times UTC.
- Run table, cascade, H2 and H3 (Figures 1 and 2): each run's report and manifest, including its AWS window's metrics and access log. Submission durations are CloudWatch p50 and p95 over each run's window.
- The harness: web #518 and its commits (cost guard, test hosts, discarded rooms, captcha fix
475576a8); web #520 and its commits (web-session preflight, key by name with the 112 + 83 keyless count in commit2e87d5e6, cleanup's key fallback, topice874293f; refreshed at 16:52Z on 2026-09-28 to wait out503 profile_unavailable); web #521 (small topics refused). - Cost estimates: the reveal-spike production plan, 2026-09-27 (runs 0-3: $0.0042, $0.0159, $0.0159, $0.0504; run 3 at 4.51% of Hobby CPU).
- Limits and fixes: leaderboard #95 to #98 (Query 50; retries and key release, 148 retries and 8 refusals in run 1), #99 (phase 2, the
absenttable, DEV live 19:09:51Z), #100 (Submission 50, its change set and stated cause, corrected indecec11); web #515 and #519. The August measurement is the rank-histogram post's. - Submission 50 and phase 2 in PROD: handoff entries 2026-09-28 16:04Z (relay key fingerprint), 16:09Z (#100 merged 16:07:56Z), 16:21Z (#101 merged; change set read in full, 11 changes, 0 replacements) and 16:30Z (
UPDATE_COMPLETE16:28:36Z, 0 failed events; reservations 50 / 50 / 10; keyless 403AUTH-ERROR-001, keyed 200 with 3 entries; the first probes' 400AUTH-ERROR-007). - The handoff log: 2026-09-27 16:20Z to 18:35Z (runs 0 and 1, the invalid captcha line, the refused proof), 22:42Z (the CloudWatch lag, no
board-cacheline yet), and the 2026-09-28 overnight section (run 2, the Grafana row and 93 = 93, run 3 with Vercel's 231 requests and the 500 ms budget, the correction and its verification, #100). - Run 3's timeline (Figure 3): the prodp3peak report (window 00:40:28Z-00:44:28Z, the ledger FAIL line) and raw data (21 test rooms created 00:40:48Z-00:40:59Z, last game finished 00:43:27Z); the handoff's 00:40Z entry (25 rows born real 00:40:51Z-00:40:58Z).
- Run 3's correction: the owner-role script and its verification read (0, 0 and 283; 46 test
createdrows; 256 of 256 activity rows test). - What the runs cost: AWS Cost Explorer,
get-cost-and-usage, daily, grouped by service and by usage type, 2026-09-26 to 2026-09-28, all marked estimated; hourly granularity refused as opt-in only. API Gateway $0.004011 / $0.011039 / $0.005548 (1,146 / 3,154 / 1,585 requests); DynamoDB $0.007087 / $0.011079 / $0.008491; CloudWatch $0 / $0.00102 / $0.00343; Lambda $0 each day. Vercel billing charges for the team, billing days 2026-09-26 07:00Z and 2026-09-27 07:00Z: totals $0.7732 and $1.0061, of which the Pro subscription $0.6667 and build minutes $0.084 and $0.252; the rest, functions and delivery, $0.0226 and $0.0874. The runs' request counts: each run's report, the "AWS api Count" for its window. - The host fix: web #525 (the DEV profile-read measurement and budgets) and #526, shipped in v1.0.0-beta.13 at 05:34Z on 2026-09-28.
- The pool A/B: its report (arms, the 53.2 ms round trip, per-game medians, the server histograms, pings by status class, cleanup and the refused outbox delete), independently re-checked read-only at 09:17Z (the VPS container list and live image, the DEV counts).
- The log deletion: the re-count and its two controls, 2026-09-28 08:07Z.
- The dashboard: the Grafana generator's leaderboard row, its log-count filter (with the 93-retries comment) and the three PROD leaderboard alert rules.
No key value, account id, API id, project reference, email address, player identity or room code appears in this post or its figures. Test-run ids appear because they name runs, not people.