
Originally published on Hearso Writing on 2026-08-18. Hearso is the team trivia game I build and run; these posts are the engineering notes from building it.
Exact rank costs more as a board grows, so we stop counting at 2,000 and estimate from 128 log-spaced counters. Reads are bounded; writes pile onto one row.
Our rank query stops counting at 2,000 and falls back to 128 log-spaced counters. That bounds what a rank read costs. It does nothing for writes, and an earlier draft of mine said it did.
DynamoDB stores our leaderboard in exact rank order, but it has no operation for "what position is this row in". The only exact answer is counting every entry ahead of the player. Asking for a count instead of the rows reduces the bytes coming back, not the reads being charged, so rank 40,000 costs forty times what rank 1,000 costs.
That is a strange thing to put in a public endpoint: the more players you attract, the more each one costs to answer.
So I wanted a player's rank on a big board to cost the same to read as it does on a small one, and to know what that trade costs somewhere else.
We keep a 128-bucket histogram on each board's metadata row. We tested it with vitest, Stryker mutation testing, a 2,501-row route benchmark on DynamoDB Local, and a 1,000-submission write run on DEV on 2026-08-19.
Short answer: a deep rank read is capped at 2,000 index entries plus one item, whatever the population, and it comes back as a range, never as a fake exact rank. The calculator scores 99.30% under mutation testing. But all 128 counters live on one item, and on DEV 475 of 1,000 submissions to one board failed at 64 in flight.
Why they failed took me two tries to answer, and I'll show you both explanations.
Why an exact rank gets more expensive as you succeed
Our index already holds every player in rank order; the table-design post covers how. Reading the top 25 is cheap. Knowing that you are 40,000th is not, because nothing in DynamoDB can jump to a position.
The tools in this story: DynamoDB Query with Select: COUNT, one small metadata item per board, vitest, Stryker for mutation testing, and DynamoDB Local for the route benchmark.
How 128 counters stand in for a count
Picture a queue you cannot see the front of. Counting everyone ahead of you is exact, but it takes as long as the queue is. So instead the room keeps a tally board: how many people hold a ticket in each price band. Count the bands above yours, and you know your position to within the size of your own band.
Precisely: the service keeps a histogram of 128 buckets per leaderboard, where a bucket is just a counter of how many players have a score in that range. The bands are logarithmic, so each one covers a constant ratio of score rather than a constant amount. The mapping, verbatim from the shipped code:
bucket = Math.min(127, Math.floor(Math.log1p(score) / Math.log(SCORE_CEILING) * 128));SCORE_CEILING is 1012, and ln(10^12) is about 27.631. Here's a concrete example: score 1,000 lands in bucket 32, score 10,000 in bucket 42, and score 1,000,000 in bucket 64. Every factor of ten costs about 10.7 buckets, because ln(10) / ln(10^12) × 128 is 10.67. Figure 1 shows ten sample scores.
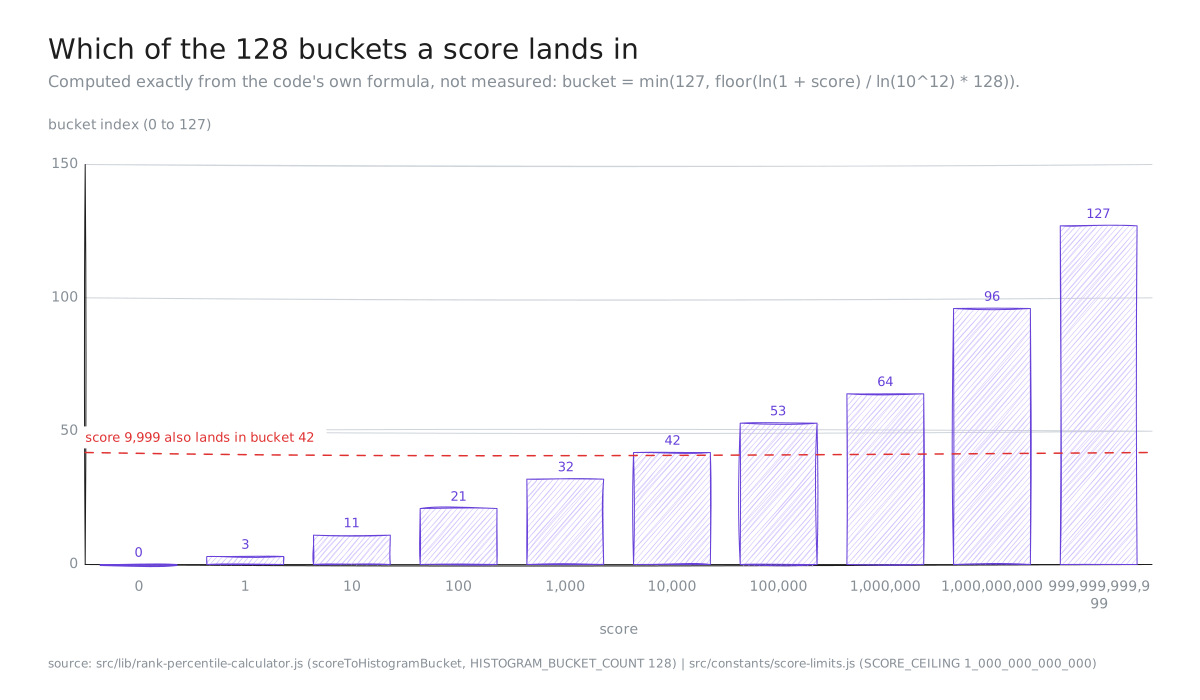
Figure 1. Bucket index for ten sample scores, produced by calling the shipped mapping function on 2026-09-18. These are computed values, not measurements.
Log spacing fits because scores are ratios, not amounts. Going from 100 to 200 points is an achievement; going from 900,000,000,000 to 900,000,000,100 is noise. Equal-width buckets over a domain of 1012 would file every ordinary trivia score into bucket zero.
A rank read touches at most 2,000 entries and one item
The query counts index entries ahead of the player and stops at 2,000. Below that, the answer is exact: rank is the count plus one.
At exactly 2,000 the count is abandoned and the board's single metadata row is read instead. The buckets above the player's own are summed, and the response carries a rank range, a percentile range and a rounded midpoint. rank stays null, because an estimate that looks exact is worse than no number. Figure 2 draws both branches.
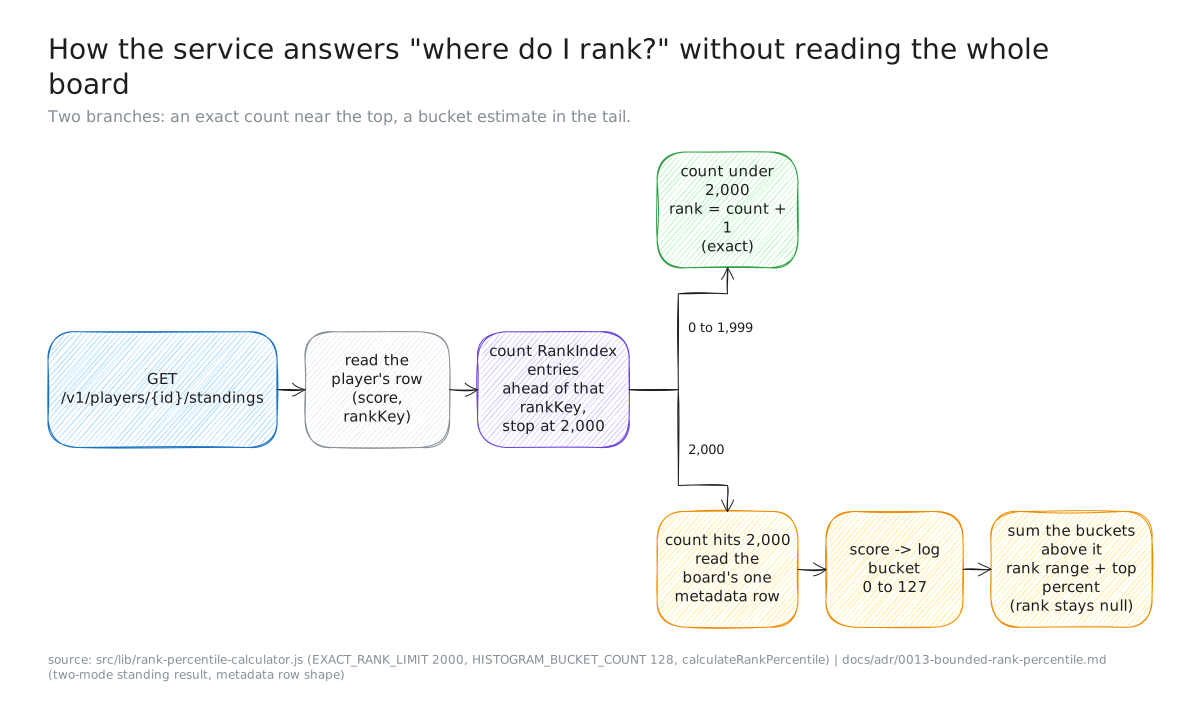
Figure 2. The read path for a player's rank, from the shipped calculator and the design document behind it.
So worst-case work is at most 2,000 index entries plus one fixed-size item, whatever the population. Constant in population is not the same as cheap: 2,000 entries is still 2,000 entries.
The width of the estimate is the honest part of the design. The player could be anywhere inside their own bucket, so the response says so. Ordering inside a bucket is invisible to the histogram, and the range deliberately covers every tied position that could be correct.
The histogram doesn't spread writes. I said it did
So much for reads. Every counter that makes a read cheap also has to be kept current by a write, and that is the side I got wrong.
An earlier draft of this write-up claimed the histogram spreads writes across buckets and so avoids hot partitions. That is wrong, and worth naming, because I believed it while I was writing it.
The histogram bounds reads. It does nothing to writes. Our rank key is still invertedScore#achievedAtMillis#playerId, with no bucket component anywhere in it, so bucketing changes nothing about which partition a score row lands on.
If anything it concentrates writes. All 128 counters for a board are attributes on a single item, so every accepted score on that board updates the same row.
What happened when 1,000 players hit one counter row
Our decision record flagged exactly that row as a risk to measure before deployment, and the measurement happened. On 2026-08-19 we drove 1,000 new-player submissions at one board on DEV. At eight in flight all 1,000 succeeded. At 64, 525 succeeded and 475 failed. Figure 3 shows how latency climbed along the way.
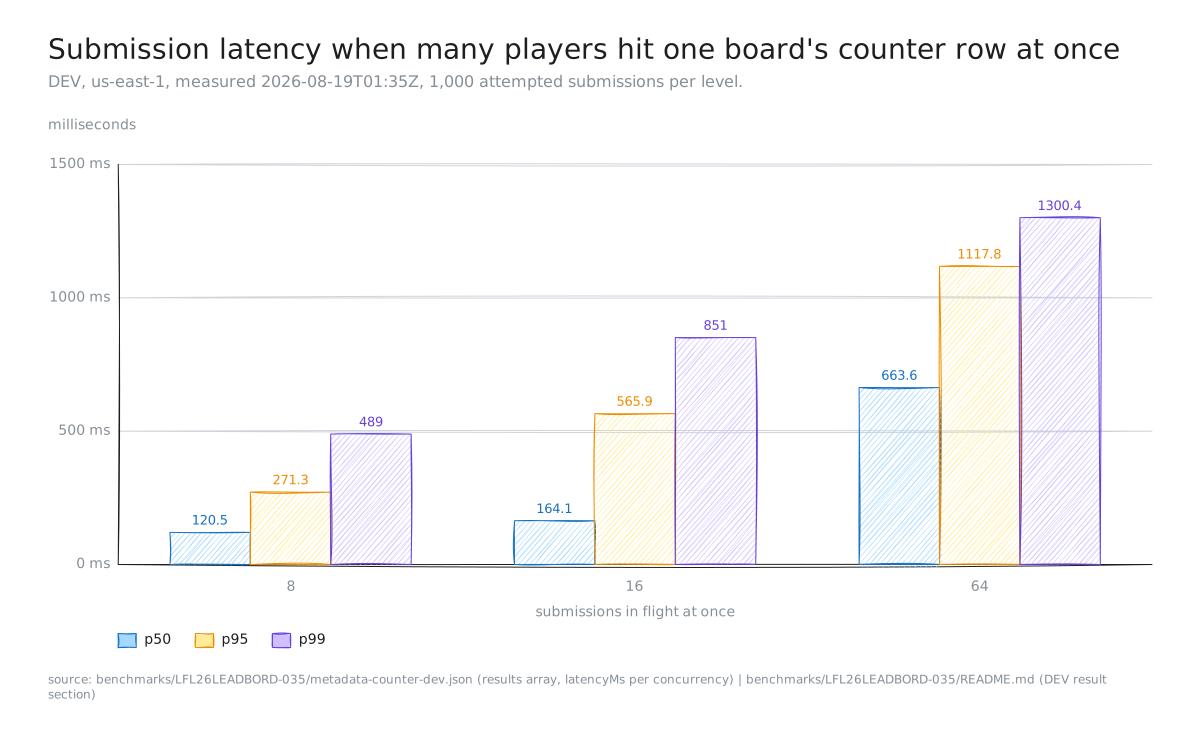
Figure 3. Latency of new-player submissions to one all-time board, DEV us-east-1, 2026-08-19T01:35:30Z, 1,000 attempted at each level. These are write-path numbers for the same row the rank estimate reads; they are not the propagation SLO measurement.
| In flight | Succeeded | p50 | p95 | p99 |
|---|---|---|---|---|
| 8 | 1,000 | 120.5 ms | 271.3 ms | 489 ms |
| 16 | 986 | 164.1 ms | 565.9 ms | 851 ms |
| 64 | 525 | 663.6 ms | 1,117.8 ms | 1,300.4 ms |
The run's decision note records that DynamoDB throttled nothing, and reads that as transaction conflict on the one counter row, not capacity.
Update, 2026-09-28: it was the Lambda limit, not the counter row. The run recorded no failure reason per request, but CloudWatch keeps five-minute metrics for 63 days, longer than the logs. In them, Lambda concurrency sat pinned at exactly 10 while Lambda throttled 2,471 invocations. The API returned 2,562 server errors in the whole run, so at most 91 had any other cause. DynamoDB gives the same 91 on its own: 2,806 idempotency reservations, 2,715 committed transactions.
Conflicts were real, 1,177 of them, but the handler's retries absorbed all but those 91 at most. The one gap is the 16 level. It shared a five-minute bucket with the 64 level, so its 14 failures are consistent with throttles but can't be attributed request by request: that bucket's 65 handler failures could cover all 14.
We re-ran the same ladder on 2026-09-28 with a reason recorded on every request, against today's code (eight attempts per conflict, not three) and today's limits. At 16 in flight, conflict failed 1 request in 1,000. At 64 it failed 50, beside 216 Lambda throttles at the function's new cap of 50 and 428 refusals from the API key's usage plan. Conflict is the next limit, not the one we hit in August.
Here is how it came out:
| Explanation | Verdict | Evidence |
|---|---|---|
| Lambda refused work above its limit | The cause | concurrency pinned at 10; 2,471 Lambda throttles against 2,562 server errors |
| Transactions conflict on the one counter row | Real, rarely fatal | 1,177 conflicts; at most 91 failures had any cause other than a throttle |
The correction above stands regardless. The histogram did not make writes cheaper, and it put every counter on one row. The re-run adds a detail: every conflict named either this row or the board's seed-lock check, never the player's own row, so a board has two hot rows, not one.
Our own sharding trigger contradicts our decision
The rule taken from that run: review sharding before more than eight simultaneous new or improving writes land on one board, or when the counter row reaches a quarter of the table's write consumption.
At the zero-failure level the table consumed 6,868 write capacity units in its peak minute. The run put the counter row's share at 29.1 percent of that, a figure it marks as inferred, since DynamoDB reports capacity per table and not per item.
The recorded decision was not to shard yet. And 29.1 percent is already past the 25 percent line in our own trigger. That contradiction sits in our notes unresolved, and I'm one of the people who left it there.
What has actually been tested, and what hasn't
| What | Evidence | Limit |
|---|---|---|
| The bucket mapping | unit tests only | no load test of 128 as a bucket count |
| The calculator's logic | 99.30% mutation score, 1 survivor of 143 mutants | one snapshot, committed 2026-08-19 |
| The route end to end | 2,501 rows on DynamoDB Local, 25 samples, p99 70.292 ms | not AWS latency, not a capacity or price measurement |
| Estimate width | rank interval 500, percentile interval 20 | one fixture, one distribution |
| The counter row under load | the DEV run above | one board, one period, new players only, no failure reasons |
The table is the same question asked of each piece: what would have to go wrong for this evidence not to hold on a real board? Two things to be plain about. The 70.292 ms p99 comes from DynamoDB Local, which reproduces neither AWS network latency nor service capacity nor billing, and the artifact says so itself. And the interval widths (500 ranks, 20 percentage points) come from one seeded distribution, so I have no idea yet whether a real board's crowding makes them wider.
What we still don't know
- Whether 128 is the right number. It is unit-tested and never load-tested. A bigger histogram is a bigger row; a smaller one is a wider estimate. Nothing has measured that trade.
- What a rank read costs on AWS. There is no per-request consumed-capacity measurement for this route at all. The follow-up that would have produced one was specified in detail and never run: no commits, no report.
- Whether the 16-in-flight failures were throttles. Consistent with it, not provable: that level shares a five-minute metrics bucket with the 64 level, and the logs that would split them have expired.
- How ordinary scores really spread. From the code's own formula, scores of 0 to 9,999 occupy buckets 0 to 42 and touch 40 distinct buckets. Three indices (1, 2 and 4) hold no integer score at all, because down there the buckets are finer than the integers they separate. That is arithmetic, not data.
- Whether the estimate is ever too wide to show. The decision record asks for median and p99 interval widths before a display policy is accepted. We have one number from one fixture.
Predictions vs outcome
| Prediction | What happened | Right? |
|---|---|---|
| Log-spaced buckets put resolution where trivia scores live | scores 0 to 9,999 use buckets 0 to 42 (computed) | Yes |
| A deep rank read costs the same at any population | bounded at 2,000 entries plus one item, by design; never priced on AWS | Yes by design, unmeasured |
| The histogram spreads writes and avoids hot partitions (an earlier draft) | no bucket in the key; all 128 counters sit on one item | No |
| The counter row is a write hot spot (the decision record's flagged risk) | 1,000 of 1,000 at 8 in flight; 525 of 1,000 at 64 | Partly: the failures are real, most were Lambda throttles (next row), and conflict on the row is the next limit |
| The failures are transaction conflict, not capacity (the run's reading) | concurrency pinned at 10 while Lambda throttled 2,471 invocations; conflict caused at most 91 failures | No: Lambda throttles at a concurrency limit of 10 (re-checked 2026-09-28) |
| A 25 percent share would tell us when to shard | the inferred share was already 29.1 percent, and we did not shard | Contradicted by our own decision |
Key takeaways
- Cap any answer whose cost grows with your success, and say so in the response. Ours stops counting at 2,000 and returns a range beyond that.
- Use logarithmic buckets for scores. Scores are ratios; each factor of ten costs about 10.7 of our 128 buckets.
- Never dress an estimate as a fact.
rankisnullon the estimated path, and the range comes with it. - Check which side of the system a structure helps. A histogram bounds reads; putting all its counters on one row concentrates writes.
- Record a reason for every failed request in a load test. Without it, two causes can hide behind one number.
- Don't take a price from unit tests or a local benchmark. They show the shape is right, not what AWS will charge.
What I'd do next
- Take load off both board-wide rows, not only this one: the 2026-09-28 re-run found every conflict on the board's seed-lock check or its histogram row.
- Log consumed capacity per request on the rank route against a run-scoped DEV board, so the read has a real price and not just a bound.
- Record median and p99 estimate widths across several distributions before any interface promises a percentile.
- Test 64 and 256 buckets against the same fixtures, so the bucket count is a measured choice rather than a reasonable-sounding one.
- Settle the contradiction above: either the 25 percent line is wrong, or the counter row is due for sharding now. It cannot be both.
Evidence
All times UTC.
- 128 buckets, the 2,000 cap, and the mapping:
src/lib/rank-percentile-calculator.js:EXACT_RANK_LIMIT = 2_000,HISTOGRAM_BUCKET_COUNT = 128,scoreToHistogramBucket, andcalculateRankPercentilereturningkind: 'estimated'withrank: null,rankRangeandpercentileRange. SCORE_CEILING= 1,000,000,000,000:src/constants/score-limits.js.ln(10^12) ≈ 27.631andln(10)/ln(10^12) × 128 ≈ 10.67are arithmetic on that constant.- Bucket indices in Figure 1, and the 0–9,999 spread: computed on 2026-09-18 by calling the shipped
scoreToHistogramBucketon each score, and by a binary search over the same function for the reachable-bucket count. Computed, not measured. - The rank key has no bucket component:
src/lib/score-key-builder.js:buildRankKeyreturns<invertedScore(13)>#<achievedAtMillis(13)>#<playerId>. - The counter row was flagged as a hot spot, and the storage shape:
docs/adr/0013-bounded-rank-percentile.md("One metadata item is a per-board write hot spot") anddocs/design/rank-percentile.md(meta#<leaderboardId>,playerCount,histogramVersion,bucket000–bucket127). - DEV write run: 1,000/1,000 at 8 in flight, 986 at 16, 525/1,000 at 64, latency percentiles (the p50 column is the run's recorded median), 6,868 peak-minute write units, 29.1% inferred share, zero throttles, and the sharding trigger:
benchmarks/LFL26LEADBORD-035/metadata-counter-dev.json, measured2026-08-19T01:35:30.415Z, deployed commite3fb772; narrative in the same directory'sREADME.md; reviewed as leaderboard PR #52. - The Lambda concurrency limit: the overnight handoff for 2026-09-26, entry 2026-09-27 ~10:55Z (
aws lambda get-account-settings:ConcurrentExecutions = 10); the increase to 1,000 was approved at 12:16Z the same day (entry ~14:20Z). The 2026-08-19 run's own metrics show concurrency pinned at 10 then too (next item). - Lambda throttles, not conflict, on 2026-08-19, and the re-run on 2026-09-28: leaderboard PR #102,
benchmarks/ice-breaker-147-submission-sweep/README.mdand itscloudwatch.json. The 2026-08-19 run's five-minute CloudWatch metrics: peakConcurrentExecutions10, 2,471 Lambda throttles, 2,562 API 5xx, 2,806 reservations against 2,715 committed transactions, 1,177TransactionConflict. The re-run repeats the ladder with a reason recorded per request. - Route benchmark: 2,501 rows, 25 samples, p99 70.292 ms, rank interval 500, percentile interval 20:
reports/LFL26LEADBORD-036/local-route-benchmark.json, measured2026-08-19T02:51:38Z, with its ownlimitationsfield naming DynamoDB Local's limits;reports/LFL26LEADBORD-036/README.mdrepeats them. - Calculator mutation score 99.30% (141 killed, 1 timeout, 1 survived of 143): recomputed from the per-mutant statuses in
reports/LFL26LEADBORD-055/mutation.json, committed 2026-08-19. - The AWS-scale measurement that never ran:
docs/archive/specifications/ticket-054-logging-specification.md;git log --allreturns no commit mentioning LFL26LEADBORD-054 andreports/holds no directory for it.