
Originally published on Hearso Writing on 2026-09-27. Hearso is the team trivia game I build and run; these posts are the engineering notes from building it.
One morning of production work turned up 20 failures. No unit test caught any of them; 11 were caught by reading the running system. Each became a check.
Between 02:10Z and 14:50Z on 2026-09-27 we shipped two releases, wired our real-time services into Grafana Cloud, and put keys on our leaderboard API. On the way, 20 things went quietly wrong.
Hearso is standup icebreaker trivia, built by a very small team with a lot of help from coding agents. The agents write most of the code, run the tests and open the pull requests. A vendor reviewer reads each pull request, and I merge.
That is fast. It is also a machine for confident, green, wrong answers. An agent that runs a check and sees no error reports success. It does not ask, on its own, whether the check could have seen the error at all. (I don't always ask either, which is rather the point of this post.)
So I wanted to know: what actually catches the failures in a day like this? My hypothesis was that unit tests would catch few or none, and that checks against the running system, the kind that say what they examined and have a positive control, would catch most.
I took every failure we found that morning, 20 of them, and recorded what first caught each one. Then I did the same for the 9 failures found while building the next release that afternoon.
Short answer: a unit test first caught 0 of the 29. Reading the running system first caught 11 of the morning's 20, reviews caught 5, and in the afternoon, checks we had written on purpose caught 4 of the 9. The unit tests weren't idle; they became the proof for most fixes. They just never found anything.
Below are the six stories behind those numbers, the check each one became, and the full table.
It follows What we got wrong about checks that pass when nothing happened, Two real-time services on one small VPS and Benchmark: WebSocket room commands against a remote database: the same services, now carrying production traffic and production keys.
Our evals come from scars, not from a spec
In machine learning the answer to "is the model right?" is an eval: a fixed test with a known answer, run the same way every time, so a claim can be compared with the truth. We borrowed the idea with one change. Our evals are not written up front from a specification. They are written after something hurts.
We used five techniques all day. None is new; their value is in using them every time.
- Positive controls. Every negative result ("0 leaked lines") gets a probe beside it that must come back positive, or the zero means nothing.
- Counts examined. "13 of 13 reads keyed" is a finding. "All reads keyed" reads the same when zero reads were examined.
- Artefact identity. The service reports its own build SHA on
/health, and the check compares it with what it claims to verify. - Fingerprints, never values. To prove which secret a service holds, compare a prefix of its SHA-256 with the prefix the receiver logs. This post quotes 8 hex digits.
- Mutants. Break the code on purpose and watch a test fail, as in Break your own code on purpose before you trust its tests.
They feed one loop (Figure 1). Step 4 matters most: a check never seen to fail has not been shown to work. A check has one job, to come out differently when the thing it guards is broken, so the only proof is to break that thing and look.
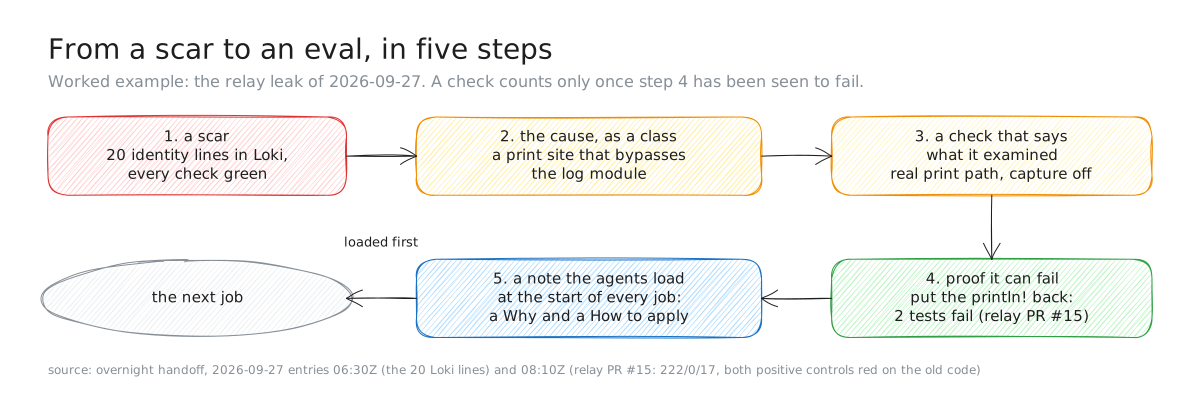
Figure 1. From a scar to an eval, with the relay leak of 2026-09-27 as the worked example. The notes in step 5 are one line per scar in an index, and each note has a Why and a How to apply.
Each claim below is one of: measured (read from a system, source named), inferred (arithmetic or reasoning on measurements), or not yet measured (stated as such, with when it will be).
What the system looked like that day
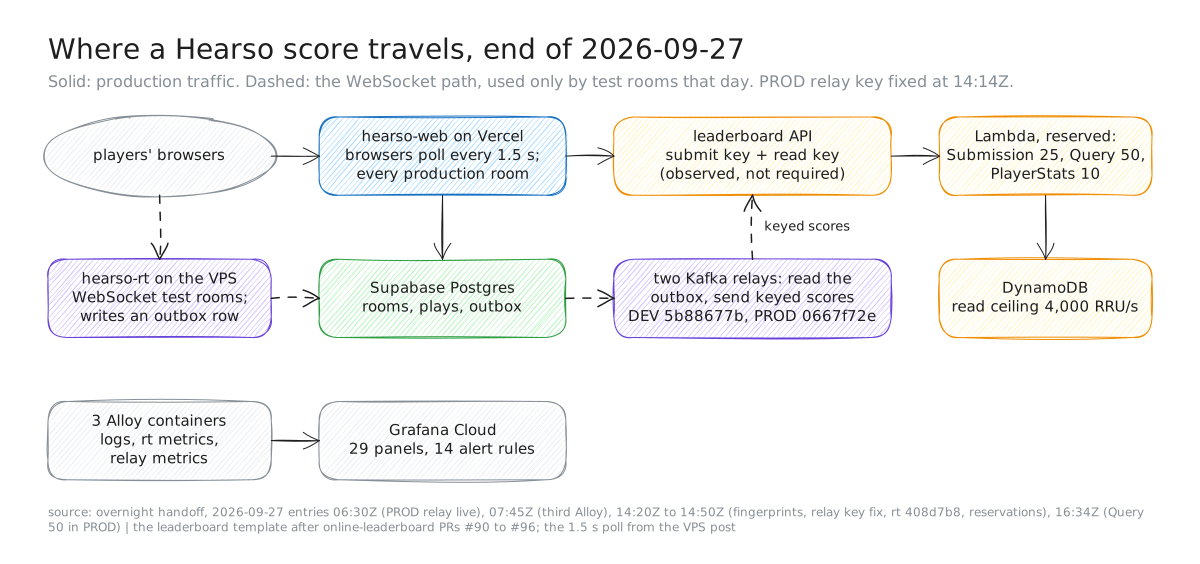
Figure 2. Where a Hearso score travels at the end of 2026-09-27 (UTC). Key fingerprints are the first 8 hex digits of SHA-256, never values. Reservations are the configured values after leaderboard PRs #90 to #96. DEV and PROD share one AWS account.
Four facts matter below.
- Two score paths. A polled game (every production game today) goes from the web server straight to the leaderboard API. A WebSocket game writes an outbox row, and a Kafka relay on the VPS sends the score. The paths share no code. The leaderboard behind both is the one in Anatomy of a score submission.
- One AWS account holds DEV and PROD, and so one pool of Lambda concurrency.
- Observability lives on the VPS, not on Vercel, for cost.
- Where the day started. At 05:46Z WebSocket answers against the production database had a median of 328 ms and a slowest of 969 ms (110 timed answers), with 0 of 136 commands unanswered; four days earlier, 22 of 41 had gone unanswered. The benchmark post has the method.
The first three are seams: two score paths that share no code, one account under two environments, and observability on a different host from the web app. Several of the stories below start at one of them.
1. Put the event count next to every zero
This is the story of player identity reaching our logs from three directions, and of a fix I declared too early.
The symptom (measured, 06:30Z). While building the log pipeline, we searched Loki. It already held player identity from the DEV relay: 10 aws_preview lines with a player id, display name and country, and 10 submission_accepted lines with an unmasked player id inside a field called commandId.
The cause. The relay's redactor had tests, but only warnings went through it; info lines did not. And commandId is built as {eventId}:{playerId}:{target}, so a redactor that drops fields named playerId still passes a player id through a field named commandId.
I recorded it as fixed, and it wasn't. Relay PR #13 routed info lines through the redactor, we deployed it, and I wrote down the leak as closed. At 07:55Z an independent local review found that the preview module printed every aws_preview command with a plain println!, around the log module entirely. That code was in the build we had just deployed.
A zero that proved nothing. The VPS's Docker log showed 0 aws_preview lines since the restart. But 0 WebSocket games had finished since then either, and only a finished game writes that line.
The same class in the other two services. A read-only audit found the leaderboard echoing what it received (country must be an assigned ISO 3166-1 alpha-2 code, received: ZZ), and the web app logging that detail to Vercel next to the player's id. The leaderboard also logged Node 22's JSON.parse message for a malformed body, which quotes a fragment of the input.
The fix, at the print site first.
- Relay PR #15 (
7c14665): the preview writes to its own file only, and the log module also dropsemail. A test runs the real print path in a child process with capture off, and a source check forbids any print macro in the preview's code. - Web PR #501, leaderboard PRs #86 and #87: a refusal is logged by status, title and log code only. Validators name the field and the rule, never the value, and the log writer refuses identity keys at any depth.
- The VPS log shipper, as a backstop: it drops
aws_preview, maskscommandIdon every line, and drops the relays' idle passes (estimated at about 450,000 lines a week).
What the numbers say (measured).
| Check | Result |
|---|---|
| Relay PR #15 tests | 222 passed, 0 failed, 17 ignored |
With the println! put back | both print tests failed (the positive control) |
| Deployed to both relays | about 08:10Z, 0 warnings, send cursor held |
| Web PR #501 controls | 4 + 4 tests red on the old code |
| Leaderboard PR #86 control | the old validator failed 12 |
| Shipper filter, live from 06:53Z | 423 idle lines dropped, so the filter runs |
aws_preview and unmasked commandId since the filter | 0 and 0, but untested: no WebSocket game finished in that window either |
Cleaning up. A 30-day search of every Loki stream found all 20 lines in the DEV relay's stream, 2026-09-24 07:12Z to 08:39Z, and no identity values in any other stream. Loki answered our delete request with 204 received; its compactor acts after about 24 hours.
Update, 2026-09-28: the deletion held. The re-count ran at 08:07:10Z over the 30 days ending then. Identity values in any stream: 0 lines. The union query (relay aws_preview events, or a commandId carrying a player segment): 0 lines. Because a zero from a query that finds nothing would prove nothing, it ran with two controls: {compose_project="hearso"} returned 293 lines in 6 streams, and the relay's own stream returned 5,000 lines (the query cap), of which 0 carried a commandId.
Why no unit test caught it. The redactor's test fed it a field literally named playerId. cargo test captures stdout, so a test searching its own output finds 0 matches whether or not the line was printed. And the web-and-leaderboard leak needed both services; each one's tests were green.
The checks it became.
- A leak fix needs a test on the real print path with capture off, and a control: put the print back, the test goes red.
- Any value formatted from an identifier is identity.
- Fix at the print site; a shipper filter is a backstop. No service prints a player's name, email or country to stdout.
- A zero is evidence only if the event that would make it non-zero happened. Say how many games finished before quoting "0 leaked lines".
- An error message is output. A validator's reason becomes someone else's log line.
2. An alert rule is live only when it's read back with data
Story 1 ended on a zero that proved nothing. The alerts repeated it in another form: a green that proved nothing.
We generated a dashboard ("Hearso · Live rooms", 29 panels) and 14 alert rules from code, and validated all 58 queries against live data before applying them. Three things still went wrong.
A 403 read as "ready" (before 07:39Z). The apply script created a Grafana folder, then got HTTP 403 writing the dashboard into it. It had already printed "folder ready". It treated only 404 as missing, so a 403 on a folder it could not use fell through to success.
Green on no data. After the apply, every relay rule read Normal. But nothing scraped the relays yet, and a rule with no data can evaluate to OK. The planned scrape over the tailnet timed out, so a third Alloy container joined the relays' own Docker network; each relay then reported up = 1 with 172 series. Each rule now evaluates per environment, a "metrics silent" rule catches both up = 0 and missing series, and each query was checked with an absent_over_time control. Read back at 07:39Z: every relay rule had 2 Normal instances with real data behind them. A test alert email, sent at about 08:40Z, arrived.
Every heartbeat counted as a server error, and I called it "by design". The benchmark's metrics showed every ping command with status_class="5xx". At about 09:45Z, after a review of our unpublished posts flagged it, we excluded pings from the 5xx alert, taking the 503 as by design. It was a bug. rt's command engine had no branch for ping, so every heartbeat fell through to its catch-all 503. The client never saw it, because the transport swaps a ping's reply for a pong; only the metric did. rt PR #19 answers ping with 200, and went live as 408d7b8 at 14:40:56Z. The deploy also reset rt's ping counters to 0/0/0, so a read just after it could not show the fix working.
Update, 2026-09-28: measured under traffic. When this post was first published, no WebSocket game had run since 408d7b8. The next day's connection-pool A/B on DEV played 10 games on that build and a branch of it: every ping answered 2xx (297 in one arm, 298 in the other). A verification game later that day counted 59 pings, all 2xx.
Why no unit test caught these. The query validation asked "does this parse and return something?", and an empty result over no data is valid. The apply script had no branch for "any other failure". And the ping 503 needed the engine and the metrics together; rt PR #19's new test counts a healthy ping's 5xx as 0, and it went red on the old code.
The checks it became.
- An alert rule is live only when read back with real data, one instance per expected series. "2 Normal instances" is a finding; "Normal" is not.
- A status check fails on every status it did not expect.
- Before alerting on an error class, find out what the service puts in it. A status no client sees can still be wrong.
- Ask whether a counter survives a restart. rt's ping counters read 0/0/0 after the 14:40Z deploy.
3. Count who would be refused before you enforce
The first two stories were about what we could not see. This one is about a rule that nothing enforced, and about what enforcing it at once would have broken.
The finding (08:40Z). That morning I set a rule: every call that leaves for the internet is authenticated, in DEV as in PROD. Read against it, the leaderboard's template required a key on no public route.
POST /scoreshad a submit key, and the function observed it, refusing only a key that belonged to another route (mismatch). The route did not require one: the expand half of a migration that never contracted.- The two board reads had no key at all, and the DEV relay had none configured.
- The web client omitted the header when its variable was unset, and the call still succeeded: a null case that reads as success.
Measure before enforcing (CloudWatch, 30 days, the Submission function's own apiKeyVerdict field):
| Environment | Submissions | With a valid key (bound) | Without a key |
|---|---|---|---|
| PROD | 4 (2026-09-26 06:18Z to 2026-09-27 02:53Z) | 4, one caller, fingerprint 0667f72e | 0 |
| DEV | 8,864 | 0 | 4,989 absent, plus 3,875 from before the field existed |
The keyless DEV callers were our own tooling: local development, local browser tests, bots and the DEV relay. Inferred: enforcing in DEV that morning would have broken all of them at once. So we chose expand, measure, then contract (Figure 3).
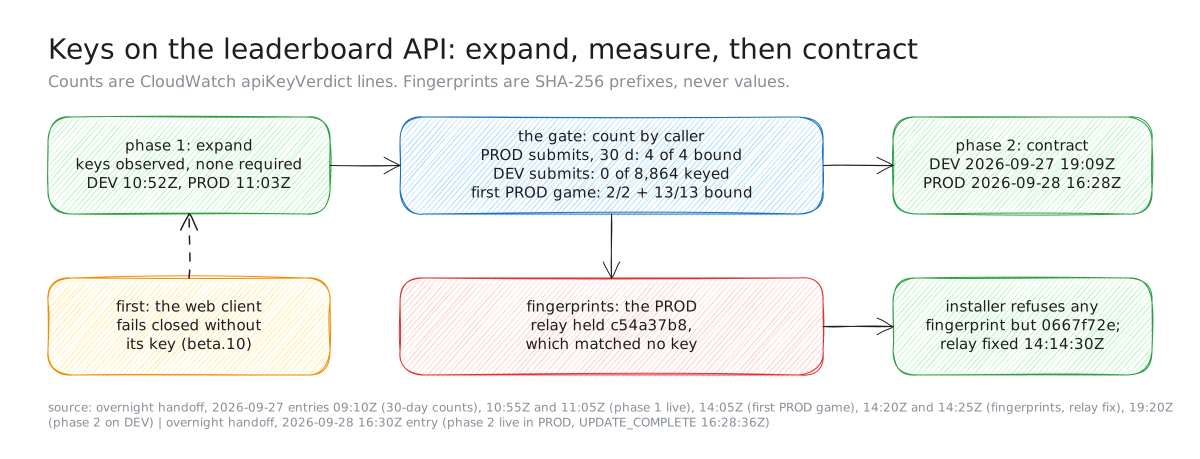
Figure 3. The key rollout on the leaderboard API, 2026-09-27 and 2026-09-28 (UTC). Without the fingerprint check, phase 2 would have refused every PROD relay score; the relay replays 5 times, 600 s apart, and PROD accepts a score only within 1 h of its achievedAt.
- Callers fail closed first. Web PR #502 makes a submission refuse to leave without its key, before any
fetch; with the oldkey ? {…} : {}restored, 7 tests failed. It shipped in beta.10. - Phase 1, expand (leaderboard PRs #90 to #92, web PR #506): a read key with its usage plan (20 requests a second, burst 40), stage throttling on board reads (40 a second, burst 80), a DynamoDB read ceiling of 4,000 units a second, and a cap of 16 boards per standings request. Every read logs a key hash and
apiKeyVerdict, and no read is refused for its key. The one tightening is the simulator route, which now refuses any key but its own; every caller was checked first. Submissions still refuse onlymismatch, and a standings request for more than 16 boards gets a 400. - Phase 2, contract: every keyed route refuses a missing or wrong key. On the morning of 2026-09-27 it was a pushed branch, gated on every recent read and submission logging
bound, counted per caller class.
Two phases, because enforcing first finds unknown callers by breaking them, and because a lost score cannot be recovered: PROD accepts a score only within an hour of its achievedAt, and a refused relay replays and then gives up.
Testing the observation before trusting it. The credential module's own comment said API Gateway never identifies a key on a route that does not require one. If so, bound could never appear on the reads, and the gate would be meaningless. The PROD count above already disagreed: 4 of 4 submissions logged bound on POST /scores, which required no key. The reads are other routes, so we tested them directly. At about 11:05Z one DEV read with the DEV read key, passed by file descriptor and never printed, returned 200 and logged apiKeyVerdict: bound, fingerprint d247daa5. A keyless read logged absent. The comment was wrong.
The key that matched nothing
A relay's hasApiKey: true proves a key is present, not that it is right. So before 14:14Z we fingerprinted every key the leaderboard knows and every key our callers hold, printing no value:
| Key | DEV | PROD |
|---|---|---|
| Submit | 5b88677b | 0667f72e |
| Read | d247daa5 | fd1cf15b |
| Erasure | 731e18fd | 88a03098 |
| Simulator | e7c8137e | 4be6643a |
The DEV relay held 5b88677b, which is right. The PROD relay held c54a37b8, which matches no key. It had not hurt yet: the PROD relay had never sent a real score, and phase 1 accepts an unknown key as unverified. Under phase 2, every PROD relay score would have been refused, replayed and, after the hour, lost, with no error reaching any player.
The fix was a small installer, run with hidden input, that refuses any value whose fingerprint is not 0667f72e. Its guards were tested first: a wrong value was refused, and the real key fingerprinted correctly. The relay restarted at 14:14:30Z with the right key and 0 warnings.
A related host check. At 05:15Z we had found that rt's allowed origins on the VPS listed only https://www.hearso.com, although the app has lived on app.hearso.com since beta.8. Nothing failed, because production rooms are polled. The origin was added at 14:21Z.
Results that day (measured). The first production game after beta.11, at 14:03Z: 2 of 2 submissions bound (0667f72e) and 13 of 13 board reads in that hour bound (fd1cf15b), 0 keyless. DEV submissions after 10:50Z: 6 of 6 bound. Preview world-board reads, 11:24Z to 11:35Z: 8 bound. One thing we had not thought through: a signed-in member's default board reads Supabase, not the API, so the gate must count world-board reads, guest reads and submissions separately.
Update, 2026-09-28: phase 2 is live in both environments. The first version of this post said the phase 2 pull request was "written and unopened". By the time the post was published it was already leaderboard PR #99, deployed to DEV at 19:09:51Z on 2026-09-27, where a request with no key or a wrong key got 403, the real key got 200, and a 12-player DEV game passed under enforcement. Before promoting it, a read-only check confirmed the PROD relay's key fingerprints to 0667f72e and matches the enabled gateway key. PROD's change set completed at 2026-09-28 16:28:36Z: an identical board request without a key now gets 403, and with the PROD read key it gets 200. The PROD relay has still not sent a real score, so its first bound submission is the last piece of this story.
Why no unit test caught it. A call with a key got 201, and so did a call with none. The web client's tests always set the variable; the relay's tests use test keys, and its real key lives only on the VPS. Each service was green; the contract between them was tested nowhere. It is the shape of the forty-two write routes in SameSite=Lax is a same-site promise: the dangerous input never reached a test.
The checks it became.
- A client fails closed when its credential is missing.
- Before enforcing a rule, count who would be refused, by class, over a window.
- Prove the verdict separates the cases (one keyed, one keyless request) before building a gate on it.
- Presence of a secret is not correctness. Fingerprint each caller's key; make installers refuse a wrong fingerprint.
- When a hostname moves, check every environment file on every host.
4. Know what the target runs before you diff against it
Story 3 counted the callers before changing what the API refuses. The deploys that carried those changes needed the same reading first. This story is about three ways a CloudFormation change set can mislead a careful reader. It rests on an older scar: on 2026-09-24 we read a DEV change set for replacements, found none, executed it, and broke production scores, because a variable that went from absent to present changed what the code enforced. A change set says what resources change, never what behaviour changes. Figure 4 shows how we read one now.
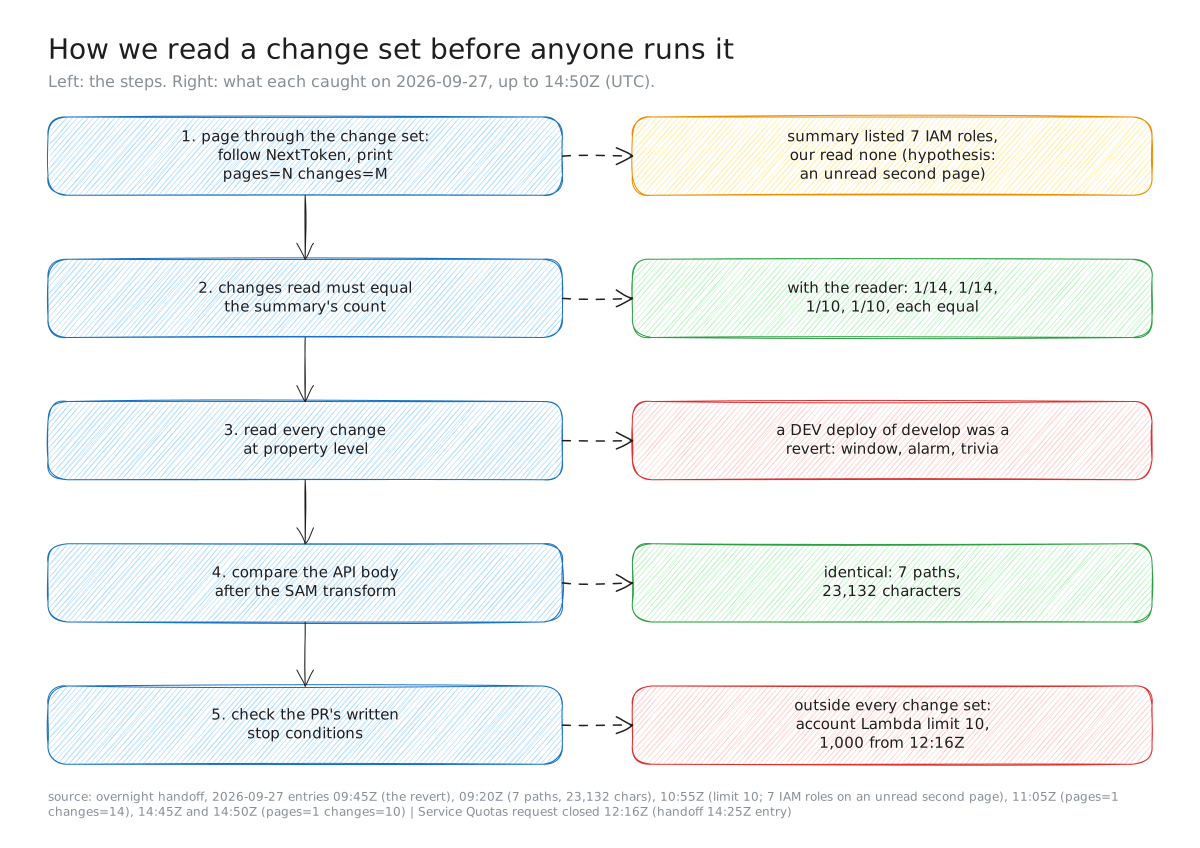
Figure 4. How we read a change set before anyone executes it, and what each step caught on 2026-09-27 (UTC). The 7 IAM roles are the deploy summary's count for a change set deleted before its second page was fetched, so the cause is a hypothesis. The account limit is not in any change set; it sits beside step 5 as the check we added.
A deploy that was secretly a revert (before 09:13Z). A DEV change set built from develop, read at property level before execution, showed the one-week achievedAt window going back to the one-hour default, the refusal alarm being removed, and ALLOWED_GAME_IDS losing trivia. DEV had been deployed on 2026-09-24 from a feature branch that never had a pull request, so "deploy develop" meant "revert that branch". We deleted the change set.
The branch became leaderboard PR #88 and merged, and the rebuilt change set changed only function code: the API body after the SAM transform was identical, 7 paths and 23,132 characters, equal including key order. DEV went live at 09:15Z and PROD at 09:21Z, each with a probe: a made-up name in a field got a 400 naming the rule, and appeared in neither the response nor the log line.
We checked the trivia loss too: DEV's last trivia# row of 4,530 was from 2026-09-26 08:23Z, before production moved to its own API, and the scan's control found the rows.
The same class, on the VPS (05:00Z). docker ps showed the relay running 3728ebe5, the tip of a sender branch that had never been a pull request: 8 commits, about 4,000 lines. Deploying develop would have dropped the --send flag. Relay PR #10 brought the sender through review, where the vendor reviewer found six issues also live on the VPS, two of them leaks in the commandId masking. The 05:35Z relay deploy also noted that the repository's compose file lacked --send; relay PR #16 fixed it that afternoon. Without it the relay drains and previews, every health check passes, and no score is delivered. A test now pins the production command; removing --send fails 2 of its 7 tests.
A limit no change set shows (10:41Z to 10:50Z). Phase 1 reserved Lambda concurrency: 25 for Submission, 10 each for Query and PlayerStats. PR #90's rollout steps said to confirm the account limit was 1,000 first. Running that step returned:
aws lambda get-account-settings
  ConcurrentExecutions: 10
  UnreservedConcurrentExecutions: 10
The step was right to exist and wrong in its expectation: the Service Quotas default is 1,000, and this account sat at a new-account level. At a limit of 10 even one reservation fails. We deleted the change set and shipped phase 1 without reservations (PR #91 made them a per-environment switch, off). Inferred: DEV and PROD had shared 10 concurrent executions across every leaderboard function, so a DEV load test could have throttled production scores. The quota increase closed at 12:16Z. PR #93 turned the reservations on in DEV at 14:34:54Z (unreserved 1,000 → 955), and promotion #94 in PROD at 14:40:49Z (→ 910).
A change set is paginated (hypothesis). The deploy summary for that first phase-1 change set listed 7 IAM roles as Modify; our property-level read showed none. Most likely describe-change-set returned a NextToken that the CLI does not follow for this call, and we never fetched page two. We could not confirm it: that change set was already deleted.
The fix is a small reader that follows NextToken and prints pages=N changes=M, and a rule: changes must equal the summary's count before anyone approves. Every later change set up to 14:50Z was read this way: phase 1 on DEV and PROD, pages=1, changes=14 each; the reservations, pages=1, changes=10 each. The evening's change sets for leaderboard #95, #96 and #98 were also read in full (story 6). Each also carried written stop conditions in its pull request (any Replace, table change, security: on a route, or change to game ids or the window).
Why no unit test caught these. The template was correct each time. The scars were a difference between the repository and the deployed system, a property of the AWS account, and a property of our reading tool. None lives in the code under test.
The checks it became.
- List every config value whose presence changes, and ask what the code does with it. "Nothing is replaced" is not "nothing changes".
- Know which commit the target runs. If it is not on your branch, your diff is a revert.
- Read account-level limits before reserving capacity.
- Changes read must equal the summary's count. Print both.
5. Check the pull request is still open before you push to it
Stories 1 to 4 were about services. This one is about how the work itself moved that day: merges, a watcher, and what review and a real browser found in one pull request.
beta.10, "Quieter Logs, Keyed Scores" (promoted at 09:31Z) carried the web log-privacy fix (#501) and the fail-closed score client (#502). beta.11, "The World Board, Within Reach" (promoted at 13:54Z) carried keyed board reads and the retired /board page (#506), one shell for every build (#507), the world board with a World/Team switch (#510), a single top-centre menu below 1,194 px (#511) and a focus fix (#512).
Merges racing agents. Three times that day, a pull request merged while an agent was still pushing follow-up work to it: #506, the beta.11 release cut #508, and #511. A push to a merged, deleted branch does not fail; it recreates the branch, and nobody reviews it. That happened twice: after #511 and after #508, and both recreated branches were left for deletion. The work was redone as #507 (after #506), #513 (after #508) and #512 (after #511), a cousin of the problem in 7 rules for two agents writing to one shared file.
A watcher that missed a live release. A script watching the public changelog reported beta.10 "not visible after 15 minutes". The page was live. The watcher searched for the literal v1.0.0-beta.10, and the page renders the v in its own element: a text search over HTML searches markup, not what a reader sees.
What the vendor reviewer found in the menu (#511). Each fix has a positive control: revert it, the new test goes red.
- A test passed on a broken selector. A unit test read rules out of
nav.csswith an unescaped regular expression, so a.matched any character, and the broken selector.hp-namebtn xhp-teampassed. - Widening the window kept the page locked after the sheet closed.
- Back and Forward stranded focus. It now returns to the menu button in a post-commit effect, because React's selection restore undid a move made in a layout cleanup.
One gap remained after #511 merged: with focus inside the sheet, a widen hid the button holding it. #512 moves focus to the desktop link for the current page; with that line removed, 2 of its 3 new tests went red.
What a real browser found and jsdom could not. #511 names two bugs its browser tests caught and its unit tests could not: the name pill sliding under the centred button, and a mousedown on the backdrop sending focus to <body>. The original complaint, a bottom tab bar stuck mid-page, was layout too: sticky positioning inside the box our smooth-scroll library translates has no bottom to hold. The tab bar was removed. The new sheet, which the same smoother would displace, pauses it while open and corrects its own position; a mutant that zeroed the correction failed the browser test with the sheet 24 px too high.
Live checks after beta.11 (measured). Signed-out /library showed the world board, which it did not before the deploy (the positive control). /board answered 308. The first production board read, at 13:55:55Z, logged bound with fd1cf15b, not DEV's d247daa5: separate keys.
The checks it became.
- Search rendered text, or a string that cannot be split across elements.
- Immediately before any push to an existing pull request, check it is still open. If it merged, branch from
develop. - Assert where focus goes, not where it is not.
- Escape any literal placed in a regular expression; prefer exact-text locators.
- Test layout behaviour in a real browser, at the breakpoints, including a resize across one.
6. Write the load test's hypotheses down before you run it
This story started as a hypothesis: a scar we tried to get before it happened. It ended with a real one.
The setup. Since beta.11, every board view reads the leaderboard API from our web server with one shared read key, so to the API the whole product is one client. How we store a board covers what one read costs; this is about how many arrive at once. The read key's usage plan allows 20 requests a second (burst 40), the stage 40 (burst 80), and the Query function had 10 reserved instances. PROD Query latency was p50 198 ms and p99 624 ms.
What that latency figure is, and is not. It is Lambda function duration, not API latency, measured over 47 invocations from 2026-09-20 00:00Z to 2026-09-27 16:40Z, the week before any load test. Read as one bucket over that window: p50 198 ms, p95 619 ms, p99 624 ms. A p99 over 47 samples is in effect the slowest call or two, most likely cold starts, so it describes an idle service, not one under load. For the same window, API Gateway saw 55 requests on all routes, with latency p50 240 ms and p99 2,106 ms. Inferred: part of the gap is the gateway, the network and the cold starts that the function's own clock does not see. Part may be route mix: the 55 include 8 requests on other routes, such as submissions, and a p99 over 55 is roughly the single slowest request.
The arithmetic (inferred, not measured). At a result's reveal, say 4 PM on a team's clock, many people open the same board in the same second. The usage plan is a token bucket: 40 tokens at once, refilling at 20 a second. Of about 100 simultaneous views, about 40 pass and the rest get 429, shown as "Could not load this right now." By Little's law, 10 instances at the median 198 ms serve about 10 / 0.198 ≈ 51 reads a second, and at the p99 about 16. What a caller sees when a read passes the bucket but meets a full reservation, we had not measured.
The decision. Raising the limits is simple, but they are the reads' only protection (there is no WAF in front of them), and they keep a flood of reads from starving score submissions. At a reveal almost everyone reads the same board, so we chose a short, shared server-side cache, and a load test that reproduces the burst before any limit changes. The trade-off is a product one: a board may be up to 5 seconds old, except that a player's own finished game must show at once.
How the cache works (web PR #515)
Board reads go through lib/board-read-cache.ts.
- Mechanism:
unstable_cache, Next's Data Cache. On Vercel it is one store shared by a deployment's function instances, and tags work across them."use cache"was unavailable becausecacheComponentsis off. Afetchwithnext.revalidatecould never hit: the contract'sX-Tracking-Id(a new UUIDv7) andX-Request-Timestampchange on every request and are part of the fetch cache key. - The key is what selects a board (game, variant, period, limit, cursor), plus a 5-second time bucket,
floor(now / 5000), and an invalidation epoch. Without the bucket,unstable_cachewould serve a stale entry once while refreshing: after an idle hour, an hour-old board. Without the epoch, a read that left before a score landed but was stored after the invalidation would look fresh. Removing either fails a test. - Never cached: a 429, a 5xx or a timeout. The shared request has its own 4-second deadline, so one impatient viewer cannot cancel a read others share.
- Never per viewer: each viewer gets a copy of the public page, and "you" is marked afterwards.
- Fresh after a game: a room that finishes with at least one score landed calls
revalidateTag(tag, { expire: 0 }), once. There is no public bypass: a?fresh=1would let one visitor loop the shared key into its limit. - Observability: one fixed line per instance per minute,
board-cache: 60s hit= miss= coalesced= error= readThrough=, with no board or player in it.
Measured LOCALLY, not in production. 100 concurrent views of one board: all answered 200 in 0.52 s, with 1 cache fill. 100 more with ?nocache=1&fresh=1: 0 new fills. One instance's first minute: 240 views, 12 calls to the service. 11,333 unit tests passed, the module has 97.4% line coverage, 9 of 9 deliberate breaks were caught, and 19 of 19 browser tests passed. The stated gap: a player who taps "See the leaderboard" before the round's submissions land still sees the board without that round; their next view is fresh.
The hypotheses, written before either run
- H1. Without the cache, a burst of about 100 views produces 429s at roughly the rate the token bucket predicts.
- H2. With it, API calls fall to about one per board per 5 seconds per warm instance, and 429s to zero.
- H3. Coalescing is per instance, so a burst spread over many warm instances makes more calls than H2's number. The test must count API calls, not only page errors.
PROD runs use synthetic players with a marked prefix (lt-<runid>-), never counted as real (no achievements, winners, feeds or emails) and erased after each run, with a zero-rows query as proof. Caps per run: at most 300 players, 1,000 page views and an estimated $1.
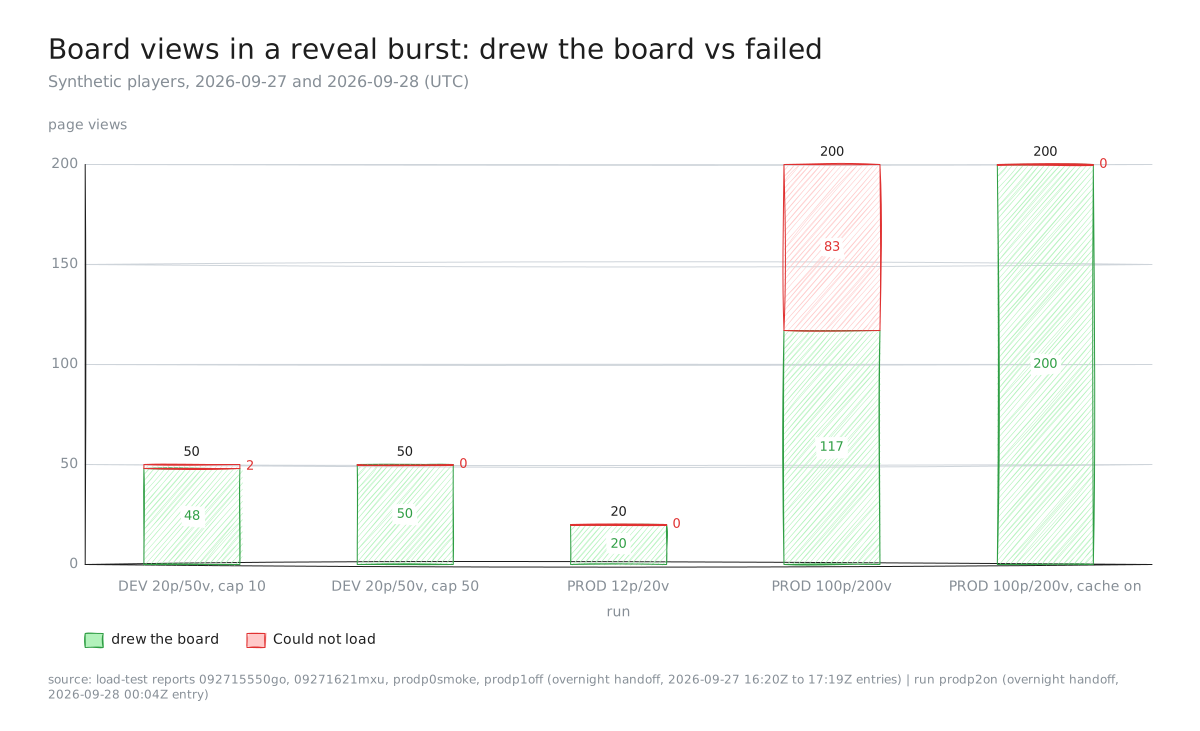
Figure 5. Page views that drew the board, per load-test run, 2026-09-27 and 2026-09-28 (UTC). p = synthetic players, v = board views within about 1 s. The first four runs had the cache off; the last is run 2 of the next post, cache on. The DEV run devab100 is left out: its page server already had the cache.
H1 failed, usefully
DEV, cache off (run 092715550go, 2026-09-27). 20 synthetic players in 2 rooms, then 50 board views. The page server was next start on a laptop against the DEV service, so page timings are not Vercel's.
- All 20 scores were accepted and distinct. The pages answered 50 of 50 with 200 (time to first byte p50 99 ms, p95 1,159 ms), but 2 of the 50 rendered "Could not load".
- The cause was the Query function's reserved cap of 10: 2 Lambda throttles, which API Gateway returned as 500, not 429. The function's log lines show 288 invocations, 8 of them cold starts.
- A new score reached the API at p95 3.8 s and the page at p95 3.0 s. The API poll saw 18 of the 20 scores; 2 never appeared in it.
- CloudWatch counted 329 Query invocations, and 210 of them were the harness's own freshness polling, not page views. A test that counts only page errors would have missed where the load came from.
H1 predicted 429s from the usage plan's token bucket. The first limit reached was one we had set that afternoon as protection, and it answered with a status the web treats as a fault, not as "slow down".
The fix (leaderboard PR #95) raises the Query cap from 10 to 50, above the read key's burst of 40, so that at this run's size the gateway no longer admits reads that Lambda then refuses.
It was deployed to DEV at 16:14:51Z (reservations 25/50/10, 870 unreserved) and to PROD at 16:34Z through promotion #96. Its change set was read in full: 10 changes, the only property change was the cap, 0 files under src/ changed, and the processed API body was identical. Afterwards 830 were unreserved, and the production world board drew its 3 real players.
A second scar from the same run. The service role can insert into the games ledger but not update or delete, by design. A guest-hosted room is created as real traffic and flagged as test only a moment later. So each synthetic room's created row read is_test = false, while its started and finished rows read true. They never counted: every traction query also filters environment = 'production', and these were DEV rows. The fix is to use the app's own mechanism: a host account flagged as test, so the room is test traffic from its first row. The reworked harness (web PR #518) fails a run if any ledger row it produced is not is_test = true. Its positive control is a test where a single false row makes the check fail.
Re-run at the same size (run 09271621mxu, Query cap 50, test-flagged hosts, cache off). 0 throttles, with Query peaking at 22 concurrent executions. All 50 pages drew the board. All 6 ledger rows (created, started and finished, for 2 rooms) were born is_test = true. Freshness p95 was 5.8 s at the API and 3.1 s on the page. Nothing was left after cleanup: 20 players erased, 2 hosts and their auth accounts deleted, and 20 table counts at 0. A separate SQL check agreed, with a control: the same query saw DEV's 5 real accounts.
PROD, cache off: reads failed, and scores were lost
Smoke (run prodp0smoke, 16:46Z, Query cap 50). Before any game, a one-host proof on PROD minted a session for a test host and read /api/profile as that host (200), confirmed the captcha refuses a browser-key sign-in, then erased the host. Run 0 used 12 players in 1 room and 20 board views over 1 s:
| Run 0 | Result |
|---|---|
| Scores | 12 of 12 submitted |
| Board views | 20 of 20 drew the board; time to first byte p50 204 ms, p95 1,218 ms |
| API | 37 requests, 0 4xx, 0 5xx; Query 25 invocations, 0 throttles, peak 6 concurrent, 5 cold starts |
| Freshness | 2.5 s at the API, 4.7 s on the page |
| Ledger | created, started and finished each 1 of 1 is_test |
| Cleanup | 12 of 12 players erased, 20 checks at 0; an independent SQL read agreed, with 430 real profiles as its control |
Baseline (run prodp1off, 17:19Z). 100 players in 9 rooms finished together, then 200 board views arrived within 1 s.
- Reads failed at scale: 83 of the 200 page views rendered "Could not load". Query reached its new cap of 50 (peak concurrency exactly 50). At the API, the run made 302 board reads: 217 answered, 74 were Lambda throttles (again returned as 500) and 11 were gateway 429s. Those 302 include the harness's own freshness polling, which is why the 85 refusals and the 83 failed pages are close but not the same count. 50 of the 217 invocations were cold starts: every new concurrent slot pays one.
- Scores were lost, which no hypothesis predicted: 8 of 100 submissions returned 500. Every submission updates a per-board histogram item (
meta#<board>) inside its DynamoDB transaction, so 100 finishes at once contend on a few hot items. DynamoDB cancelled the colliding transactions (TransactionCanceledException, 148 retries). The old policy, 3 attempts with waits of about 25 and 50 ms, was not enough. The web server does not retry a failed submission: it recordssubmitted = false, and the score never reaches the board. - Cleanup held at this size: 100 of 100 players erased and 20 checks at 0. The ledger's 27 rows were all
is_test, confirmed by an independent read.
Back to the arithmetic. For about 100 views at once, the token bucket predicted about 40 passing and the rest refused with 429. PROD run 1 sent 200 views and 117 drew the board. Across all 302 board reads, the refusals were 74 Lambda throttles returned as 500 and 11 gateway 429s. The first limit reached was the reservation, not the bucket, so the arithmetic named the wrong limit and the wrong status.
The score-loss fix came in two halves that only work together
- A, leaderboard #97, tries a cancelled transaction up to 8 times (7 retries), with full-jitter waits capped at 200 ms, and retries only for conflict or throttle reasons.
- B, web #519, retries a transient failure (5xx, 429, network) with the same idempotency key.
The number 8 came from a model, because DynamoDB Local never cancels a transaction, so no local test could reproduce the collision. The model was calibrated until the old policy reproduced the measurement (about 120 to 150 retries and 8 to 12 failed players per 100, against the 148 and 8 measured). At the same waiting budget, more attempts beat longer waits.
Found while building B: a failed request kept its idempotency key reserved for 24 hours, so the same-key retry was refused with 409 "still in flight". The web-side agent found it by running the real handler against a stateful fake DynamoDB, with a control where the replay landed once the reservation was removed. #97 now releases the key, but only when the write definitely did not commit (a cancelled transaction writes nothing), and only its own reservation, through a conditional delete on a per-request token. A timeout, where the write may have landed, keeps the key.
Re-measured on DEV (run devab100, 18:04Z, #97 deployed, web server built from #519). 100 players, 9 rooms, the same burst as PROD run 1:
- 100 of 100 scores landed (100 × 201, 0 5xx).
- The collisions still happened: 145 cancelled transactions, the same scale as PROD's 148. So the zero is not an empty read. 100 requests needed a first retry, 39 a second and 6 a third. The old policy stopped at 3 attempts, so those 6 would have been lost, close to PROD's 8.
- The web retry was never needed, so this run does not exercise B. Its tests and #97's integration test (released key, replay lands 201) cover it.
- Inferred: the page reads in this run went through the 5-second cache. The report labels the run
cache=off, but the local server was built from #519, whose branch already contains #515. A time to first byte of p50 5 ms and a Query peak of 2 concurrent executions fit a cache. So these reads are not comparable to PROD run 1's.
In production (18:19Z), through promotion #98. The change set was read in full: only the functions' code, exactly #97's 4 files. The template and the API body were unchanged. Afterwards the PROD Submission function's code hash equalled the package DEV was measured on. That is how "the thing we tested is the thing that shipped" was checked, rather than assumed.
A scar we repeated. Both evening fixes ran on DEV before they merged: #95 from 16:14:51Z (merged 16:30:23Z), and #97 from 18:03Z (merged 18:15:01Z). That is row 10's class: the target ran a commit that was not on develop. It did not become a revert this time. #98 records that develop's tip had the same tree as the commit DEV ran, and each PROD change set showed only the expected change. But that was a check after the fact, not a rule that prevented it.
Update, 2026-09-28: the cache in production. Run 2 (prodp2on, 00:04Z, 100 players and 200 views, cache on, beta.12 live) drew 200 of 200 boards, with 96 Query invocations, 0 throttles and a peak of 3 concurrent (run 1: 217, 74 and 50). That is H2's direction. 99 of 100 scores landed; the next limit was Submission's own reservation of 25, where 16 throttled, the web retry recovered 15 and 1 was lost. Run 3 (300 players, 1,000 views) was not valid as a reveal measurement: the laptop could not open that many connections. Both runs, and H3, are the next post's story.
All 20, and what caught each one
Rows 1 to 20 are the failures found on 2026-09-27 between 02:10Z and 14:50Z, and the last column is what first caught each. The unnumbered reveal-spike row at the end is the afternoon's load-test finding from story 6, not counted in the 20. The first row was told in full in the VPS post.
| # | Scar | Root cause, as a class | The check it became | First caught by |
|---|---|---|---|---|
| 1 | Our kit would overwrite the VPS's existing log shipper's config | Assumed an empty host | Inspect names and paths on a shared host before writing | Reading the host (docker inspect) |
| 2 | 20 identity lines in Loki | Info path skipped the redactor; name-keyed redaction | Leak tests run the real print path with capture off | A Loki search |
| 3 | The "fixed" relay still printed identity via println! | Fixed where logs arrive, not where they are printed | Fix at the print site; the shipper is a backstop | Independent local review |
| 4 | "0 leaked lines" with 0 games finished | A zero with no opportunity | Put the event count beside every zero | Reading the zero's context |
| 5 | Web logged the leaderboard's echoed country with a player id; the leaderboard quoted malformed JSON | Identity inside another service's message | An error message is output: name the rule, never the value | Read-only log audit |
| 6 | The apply script said "folder ready" on a 403 | Handled only 404 | Fail on every status not expected | The next write was refused |
| 7 | Relay alert rules Normal with nothing scraped | No data evaluates OK | Read rules back with real data, per series | Read-back with instance counts |
| 8 | Every rt heartbeat counted as a 5xx | A catch-all status on a command with no branch | Find out what the service puts in an error class | The benchmark's metrics |
| 9 | The API accepted scores with no key; the client failed open | Expand phase never contracted | Count who would be refused, by class, before enforcing | Reading the template against the new rule |
| 10 | Deploying develop to DEV would revert a never-merged branch | Target ran an unmerged commit | Know what the target runs before diffing | Property-level change-set read |
| 11 | The VPS relay ran a never-merged branch; the repo's compose file lacked --send | Same, on a host | Pin the production command in a test | docker ps and docker inspect before deploying |
| 12 | Reservations impossible at a limit of 10 | Account limits are invisible to change sets | Read get-account-settings before reserving | The rollout step's read |
| 13 | 7 IAM changes listed but not read | Change-set pages not followed (hypothesis) | Changes read must equal the summary | Comparing the two counts |
| 14 | The release watcher missed a live release | Literal string split across elements | Search rendered text | A person looking at the page |
| 15 | Late pushes after three merges; two recreated merged branches | A push to a merged branch succeeds silently | Check the pull request is open before every push | Noticed after each merge |
| 16 | A test passed on a broken selector | Unescaped regular expression | Escape literals; prefer exact-text locators | Vendor review (#511) |
| 17 | Resize kept the scroll lock; Back stranded focus; a resize hid the focused button | Focus asserted by absence; layout untested | Assert where focus goes; test across breakpoints | Vendor review (#511) |
| 18 | The name pill slid under the button; a backdrop mousedown sent focus to <body> | jsdom has no layout | Layout behaviour is tested in a real browser | Browser tests (#511) |
| 19 | The PROD relay's key matched no key | Presence checked, not correctness | Fingerprint every caller's key | Fingerprint comparison |
| 20 | rt's allowed origins missed the app's host | A hostname moved; host env files unchecked | Check every host's env files when a hostname moves | Reading the VPS env file |
| — | The reveal spike: DEV throttled at our own cap of 10, surfaced as 500s | The protective cap sat below the gateway burst it was meant to back | Load test with a hypothesis per limit; raise Query to 50 (leaderboard #95) | A read of the running system: the DEV re-run at 50 had 0 throttles, and PROD with 100 players and 200 views reached 50 |
Did the hypothesis hold?
The hypothesis predicted that few or no failures would be caught by a unit test, and that most would be caught by checks against the running system. Counting the last column of the table:
| First caught by | Failures | Rows |
|---|---|---|
| A read of the running system that stated what it examined | 11 | 1, 2, 4, 7, 8, 10, 11, 12, 13, 19, 20 |
| A review: independent agent, audit or vendor reviewer | 5 | 3, 5, 9, 16, 17 |
| A person noticing after the fact | 2 | 14, 15 |
| The system refusing the next call | 1 | 6 |
| A browser test | 1 | 18 |
| A unit test | 0 | none |
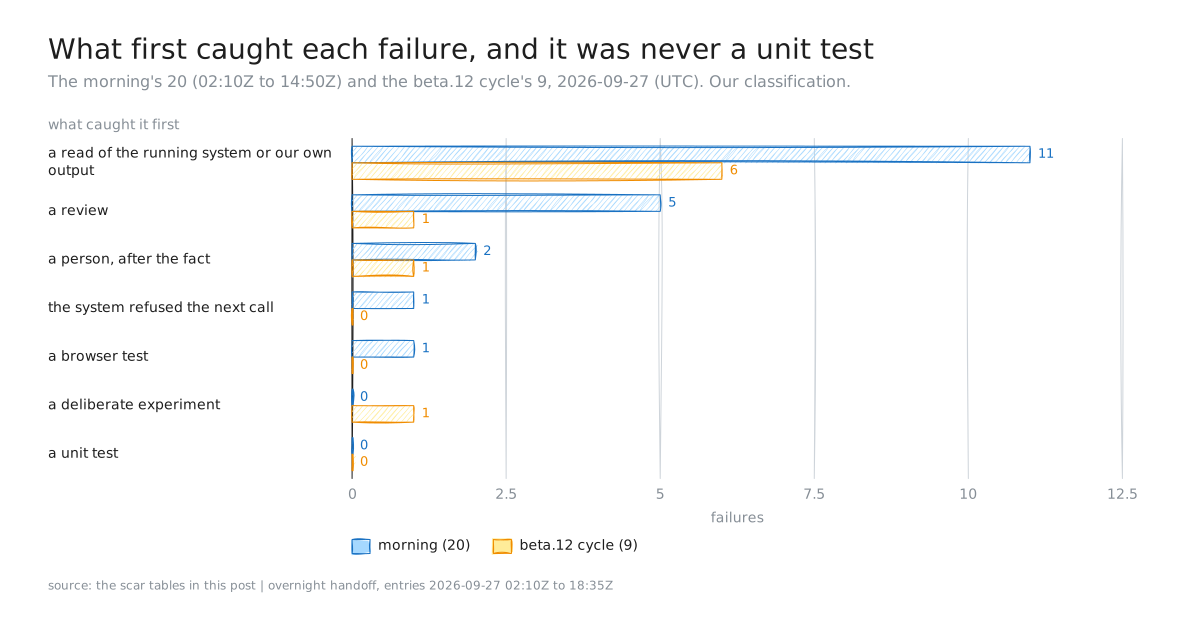
Figure 6. What first caught each failure in the two scar tables of this post, 2026-09-27 (UTC). The categories are our own classification; the reveal-spike row of the morning table is left out.
The first half holds. No failure of the morning was caught by a unit test, and 11 of 20 were caught by reading the running system. The unit tests were not idle: they became the proof in step 4 of Figure 1 for most of these fixes. But none of them found a failure. The failures sat on channels a unit test cannot see: output the test harness captures, layout jsdom does not have, a contract between two services, an account quota, a deployed commit, our own scripts.
The second half holds, narrowly. 11 of 20 is 55%. Reviews caught 5 failures that no check of ours would have: the println!, the echoed detail, the missing key requirement, and two of the menu bugs. So checks do not replace review; a reader who did not write the change still finds what the author cannot see. That is also the lesson of Every pull request was reviewed. The branch they made was not.
Positive controls matter for the zeros. When a check found something, the finding was its own evidence. The negative results are where controls earned their place. The morning's negatives that had one: the alert read-back (absent_over_time), the trivia scan, the keyed read beside the keyless one, and the installer's refusal test. The zeros without one, the aws_preview counts on the VPS and in Loki, proved nothing that morning, because no game that could write the line had finished. (The Loki re-count the next day had its controls.)
The afternoon's nine, counted the same way
The load test, the new harness and the reviews of this release found 9 more failures (numbered on their own):
| # | Failure | First caught by | Became |
|---|---|---|---|
| 1 | The Query function's own cap of 10 was the first limit a burst reached, and its throttles reached players as 500s | A read of the running system (the DEV load test) | leaderboard #95, the cap raised to 50 |
| 2 | A guest-hosted test room's created ledger row was born as real traffic | A read of the running system (the ledger rows of the run) | web #518, test hosts plus a ledger check that fails the run |
| 3 | news.hearso.com's Writing list froze after Back from a scrolled post | A person, on the live site | web #517, and a Back test in a real browser that fails on the old code |
| 4 | The captcha probe asked with the one key the captcha never applies to | A read of the output against what we expected | web #518 commit 475576a8, a browser key or "not examined" |
| 5 | A malformed link fragment threw from an effect | A review (the vendor reviewer) | web #516, one decoding helper at two sites |
| 6 | 8 of 100 scores lost when 100 players finished together | A read of the running system (the PROD load test) | leaderboard #97 |
| 7 | A failed submission kept its idempotency key for 24 hours, so a retry could never land | A deliberate experiment: the real handler against a stateful fake database | leaderboard #97, the key released only when nothing committed |
| 8 | A rate-limited review request read as "waiting" forever | A read of our own scheduler's output | the scheduler treats a refused request as not asked |
| 9 | A latency figure that was the slowest of 47 idle calls | Re-reading the data behind a number | the number now carries its window and sample size |
A read of the running system or of our own output first caught 6 of the 9. One was caught by review, one by a person, one by an experiment, and none by a unit test.
The difference from the morning is where the reads came from. Four of those six were checks we had written on purpose: the load-test harness (twice), its ledger accounting and the scheduler's own log. The captcha probe does not count: it was itself the defect, and a read of its output caught it. Among the morning's 20, the reads were mostly ad hoc. If the loop in Figure 1 works, that is the way it should move: fewer finds by chance, more by checks written on purpose. That is a small sample and one cycle, so it is a direction, not a result.
Predictions vs outcome
| Prediction | What happened | Right? |
|---|---|---|
| Few or no failures are first caught by a unit test | 0 of 20 in the morning, 0 of 9 in the afternoon | Yes |
| Most are caught by checks against the running system | 11 of 20 (55%); reviews caught 5 no check would have | Narrowly |
| Relay PR #13 closed the identity leak | a println! still printed it; closed by PR #15 | No |
| The ping 503 is by design | it was a missing branch; fixed by rt PR #19, all pings 2xx under traffic on 2026-09-28 | No |
| API Gateway never identifies a key on an unrequired route | a keyed read logged bound | No |
A relay with hasApiKey: true holds the right key | the PROD relay held c54a37b8, matching no key | No |
| The account's Lambda limit is 1,000 | it was 10, until 12:16Z | No |
| H1: a burst meets the token bucket first, with 429s | it met our own reservation first, as 500s | No |
| H2: the cache takes the burst | 200 of 200 views, 0 Query throttles in run 2 (2026-09-28) | Yes, at that size |
| No hypothesis predicted lost scores | 8 of 100 were lost in PROD run 1 | We missed it |
Key takeaways
- Put a reason beside every zero, because "0 lines" with 0 games is not a result.
- Fix at the print site, because a filter where logs arrive protects one destination and the print protects them all.
- Observe before you enforce. Observing found 4,989 DEV submissions that arrived with no key (plus 3,875 older ones from before the field existed, which can't be classified), and fingerprinting found a production key that matched nothing, before either could cost a score.
- Don't take a secret's presence as proof it's the right one:
hasApiKey: truewas true of the wrong key. - Read the whole change set, and count what you read. Deleting one costs nothing; two were deleted that day, one that would have reverted DEV and one that could not have succeeded.
- Know what the deployed target runs, because a commit that is not on your branch turns your deploy into a revert. We found it twice in one morning, in two repositories, and repeated it twice that evening without harm.
- Keep review alongside checks, because five of twenty failures were found by someone reading, not by something running.
- Expect a fix to move the limit, not remove it. Raising Query's cap from 10 to 50 moved the failure to the new cap, and the cache moved it on to Submission's reservation of 25.
What I'd do next
- Measure the cache in production. Done, 2026-09-28: runs 2 and 3 ran on 2026-09-28 (see the update in story 6). H3 still needs a load generator that can open 1,000 connections; that is the next post.
- Measure the pool acquire. Done on DEV, 2026-09-28: skipping the ping-before-use in hearso-rt's connection pool (
test_before_acquire(false)) cut the client'sroom.answerp50 from 310.8 ms to 257.2 ms, n = 150 answers per arm, one run per arm. The confounds and the rest go in the next post. - Enforce phase 2. Done: live in DEV on 2026-09-27 and in PROD on 2026-09-28 (story 3). Still open: the PROD relay's first real
boundsubmission. - Re-count Loki. Done, 2026-09-28: 0 lines, with controls (story 1).
- Turn rules that are still notes into scripts. Candidates: a "zero with context" helper that refuses to print 0 without an event count; a change-set reader that is the only way an agent reads a change set; a pre-push hook that checks the pull request is open.
- Alert on the data-loss clock. PROD accepts a score only within an hour of
achievedAt, so a relay down for more than an hour loses scores. A broker recreate that empties topics while cursors point past the end is a second silent-loss hazard. - Add a saturation alert. The load tests read Query's concurrency against its reservation (50 of 50 in PROD run 1), but no dashboard or alert watched that ratio on 2026-09-27. Partly done, 2026-09-28: a PROD alert on any leaderboard function above 80% of its reservation went live at about 00:35Z. For rt's database pool we still see latency and errors, not how close it is to a limit.
How we measured, and what we did not
- Small samples. Phase 1's PROD evidence is 2 submissions and 13 reads from one game in one hour. That shows the mechanism works, not that every caller class behaves.
- A biased sample. Signed-in team boards read Supabase, not the API. Any statement about "all reads" covers only what the API sees.
- The WebSocket path is unproven in production. The DEV relay has had the right key since 08:40Z and the PROD relay since 14:14Z on 2026-09-27, and no real WebSocket game has run through the PROD relay since.
- The reveal spike is half measured. Cache off, we have PROD runs of 12 and 100 players and DEV runs of 20 and 100. Cache on, we have web #515's local numbers, a DEV run whose page server already had the cache, and one PROD run of 100 players (2026-09-28). H3 is open.
- The score-loss fix was proven on DEV first. The leaderboard half is live in PROD and runs the exact package DEV measured. The web half (#519) shipped with beta.12; PROD run 2 was its first production test (99 of 100 landed, the 1 lost to a new limit).
- The failure model is a model. The retry numbers of #97 were chosen on a simulation calibrated to one PROD measurement, because DynamoDB Local never cancels a transaction. The DEV re-run matched PROD's collision count (145 against 148), which supports the model for that burst size and no larger.
- The pagination cause is a hypothesis. The change set was deleted before we fetched page two.
- The classification is ours. Another reader might file row 9 under "a read of the running system", because the template was read against the new rule before CloudWatch was counted. That would make it 12 against 4, and it would not change the unit-test count.
- One morning is one morning. We list only what we found. Failures nobody found are, by definition, not in the table.
What shipped with this post: v1.0.0-beta.12
This post shipped with v1.0.0-beta.12, "Ready for the Reveal", live at 22:42Z on 2026-09-27. The release carries the web half of what the post describes:
- The five-second board cache (web #515).
- The score retry with the same idempotency key (web #519). The leaderboard half of the score fix, #97, has been live in production since 18:19Z, and the deployed code hash matches the package that DEV measured.
- The Writing page's Back fix (web #517), the scar a person caught.
- The Contents launcher (web #516), with the malformed-fragment fix its review found.
- The load-test harness (web #518), which found this cycle's first scars.
The leaderboard's Query cap of 50 (#95 and #96) went live separately, before any of the PROD runs. The harness change that lets a run target a production build that is not on the domain yet (web #520) stayed out of this release on purpose; it exists for the next measurement.
Evidence
All times UTC, 2026-09-27 unless stated. "The handoff" is our overnight handoff log; its 2026-09-27 and 2026-09-28 entries are the source for most lines below.
- The system (Figure 2): container list and env files read on the VPS; the leaderboard template after online-leaderboard PRs #90 to #96; the 1.5 s poll from the VPS post. The latency numbers are the benchmark post's:
room.answern = 110 client samples, p50 328 ms, p95 682 ms, max 969 ms; 0 of 136 commands unanswered; the 2026-09-23 baseline of 22 of 41 unanswered. - Story 1: handoff entries 06:30Z (the 20 Loki lines), 06:53Z (the shipper filter and its counts), 07:40Z (the 30-day search, the delete request), 07:55Z (the
println!, the zero with no games), 08:10Z (PR #15 deployed). Relay PRs #10, #13 and #15 (7c14665: 222 passed, 0 failed, 17 ignored, and its controls); web PR #501 and leaderboard PRs #86 and #87, with their controls. Operations notes on redaction by field name and on identity on stdout. The re-count: handoff entry 2026-09-28 08:07Z (0 identity lines, union 0; controls 293 lines in 6 streams and 5,000 relay lines with 0commandId). - Story 2: handoff entries 06:30Z (29 panels, 14 rules, 58 queries), 07:40Z (the 403), 07:45Z (the third Alloy, 172 series, the 07:39Z read-back), 09:45Z (pings excluded), 14:50Z (
408d7b8, the 0/0/0 counters). The handoff's 05:46Z entry (pings mislabelledstatus_class=5xx). rt PR #19 and its control. Pings under traffic: handoff 2026-09-28 pool A/B entry (all 2xx, 297 and 298) and the ~15:45Z verification game (59 × 2xx). - Story 3: handoff entries 05:15Z (the origin), 08:40Z to 09:10Z (the rule, the DEV relay key, the CloudWatch counts), 10:55Z to 11:40Z (the probes,
d247daa5), 13:55Z to 14:25Z (preview reads, the first production game, the fingerprint table, the relay fix at 14:14:30Z, the origin at 14:21Z). Web PRs #502 and #506; leaderboard PRs #90 to #92. Phase 2: handoff 19:20Z entry (leaderboard #99 on DEV from 19:09:51Z, probes, a 12-player game) and 23:10Z entry (#99 merged to develop); handoff 2026-09-28 16:04Z to 16:30Z entries (relay-key check; PROD change set UPDATE_COMPLETE 16:28:36Z; keyless 403, keyed 200). - Story 4: handoff entries headed 09:45Z (the revert and the
triviascan; the change set predates PR #88's merge at 09:13Z), 09:20Z and 09:30Z (DEV and PROD live, the probes), 10:55Z (limit 10; 7 IAM roles, "detail on a second page, unread"), 11:05Z (pages=1, changes=14), 14:25Z (quota closed 12:16Z), 14:45Z and 14:50Z (reservations,pages=1, changes=10, 955 and 910). Leaderboard PRs #88 to #94; relay PRs #10 and #16. The operations note on a deploy that fills in missing config, with its pagination addendum. - Story 5: web PRs #503 to #514 (merge times: #505 at 09:31:13Z, #514 at 13:54:31Z; #511's three findings and controls, the two browser-only bugs, #512's control); the merge races are #506 → #507, #508 → #513 and #511 → #512, and the two recreated branches are named in the handoff's 13:55Z and 14:00Z entries; handoff entries 09:50Z (the watcher) and 14:00Z (the live checks,
fd1cf15bat 13:55:55Z). - Story 6:
- The limits come from leaderboard PR #90. The PROD Query latency sample comes from CloudWatch, 2026-09-20 00:00Z to 2026-09-27 16:40Z (47 invocations, 55 API requests). The cache and its local numbers come from web PR #515.
- The load-test harness is web #518; the candidate-build flag and the web-session preflight are web #520.
- The runs are DEV
092715550goand09271621mxu, PRODprodp0smokeandprodp1off, and DEVdevab100. Each has its report and manifest, plus independent SQL reads with controls (430 real PROD profiles, 5 real DEV accounts). - The Query cap is leaderboard #95 and #96. The score fix is leaderboard #97 and #98 and web #519, with CloudWatch Logs of the Submission functions for 17:19Z to 17:23Z (PROD) and 18:04Z to 18:08Z (DEV).
- The key-reservation probe is the one described in web #519.
- The unmerged DEV runs: leaderboard #95 deployed 16:14:51Z (its body), merged 16:30:23Z; #97 on DEV from 18:03:11Z (#98's body, with the tree equality), merged 18:15:01Z. Merge times are GitHub's.
- The PROD change sets were read in full for #96 and #98, with the deployed code hash compared against DEV's.
- Runs 2 and 3: handoff entries 2026-09-28 00:04Z (
prodp2on) and 00:40Z (prodp3peak). - The beta.12-cycle scars come from web #516 to #520 and the scheduler's log.
- The pool A/B: handoff 2026-09-28 morning summary (DEV, 08:18Z to 09:02Z, 10 games, n = 150 answers per arm).
- beta.12 live: handoff 22:42Z entry (Vercel READY at 22:42:01Z; promotion #524). The saturation alert: handoff 2026-09-28 ~00:35Z entry (Grafana v3, 3 PROD leaderboard rules).
- The scar tables, Figure 6 and the counts: the rows above; the classification is ours.
Corrections to the first version of this post (2026-09-28): it said three late pushes recreated merged branches; three merges were raced, and two branches were recreated. It said phase 2 was an unopened pull request; see story 3. The Loki re-count and the ping measurement it promised are now in stories 1 and 2.
No key value, account id, API id, email address, player identity or room code appears in this post or its figures.